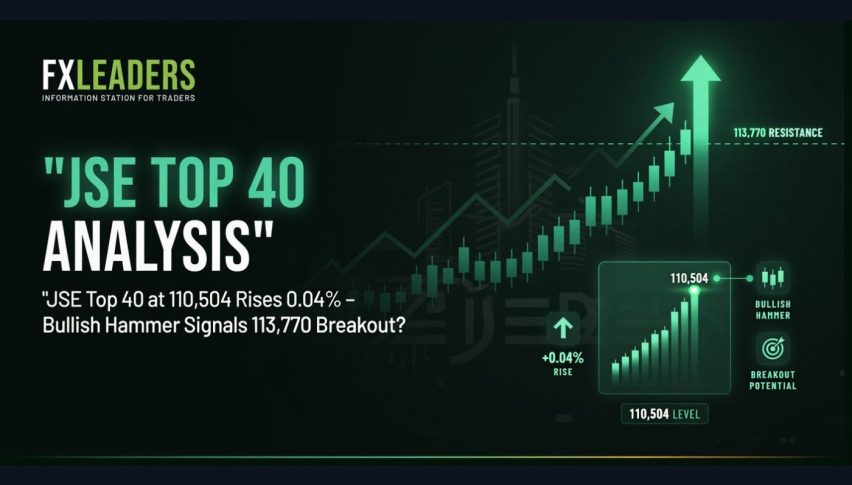
JSE Top 40 at 110,504 Rises 0.04% – Bullish Hammer Signals 113,770 Breakout?
As of May 14, 2026 - the FTSE/JSE Top 40 Index is trading at about 110,504.5 ZAR , after a gain of 0.04% on the day as it continues...
Quick overview
- As of May 14, 2026, the FTSE/JSE Top 40 Index is trading at approximately 110,504.5 ZAR, reflecting a 0.04% gain as it continues its recovery.
- Improved global risk appetite and easing US-Iran tensions are benefiting South African stocks, particularly in the mining and resources sector.
- The South African Rand's strength is aiding exporters and making imports easier, while major mining companies are seeing gains due to rising precious metal prices.
- Technical analysis suggests a potential upward trend for the JSE Top 40, with key resistance levels identified at 111,336 and 113,770.
As of May 14, 2026 – the FTSE/JSE Top 40 Index is trading at about 110,504.5 ZAR , after a gain of 0.04% on the day as it continues to build on the recovery it started a while back.
Key Drivers – Today
- Global Risk Appetite Is Improving: South African stocks are catching a bit of a tailwind from the stronger US stock market and the easing of those US-iran tensions – that’s helped some commodity-linked stocks.
- Mining And Resources Heavyweights Lead The Charge : AngloGold Ashanti, Gold Fields, Impala Platinum, Sibanye Stillwater – all the big names in mining and resources are up. The fact that precious metals are up and energy costs are low is helping those companies out.
- The Rand Is Stronger : It’s lifted some of the bigger exporters – and made it a bit easier for them to import things they need.
- Market Context : Its worth noting that while some of the banking and consumer stocks had a pretty mixed day, other big players like Naspers/Prosus and Richemont have done okay – probably because there is a lot of interest in emerging markets at the moment.
The JSE still gets a lot of support from its heavy reliance on mining and resources – but it’s still sensitive to all sorts of global factors , including the price of oil , the value of the rand and what’s happening in the rest of the world.
JSE Top 40 Technical Analysis
The JSE Top 40 has formed what looks a bit like a ‘hammer’ shape on the 2H chart after it touched the black line that’s been trending down since the highs in March (around 115,956) and the blue moving average line around 109,276-109,743. And so far, it’s holding up at higher lows since that dip it had in April (around 102,464) – that’s starting to look like a falling wedge breaking upwards.
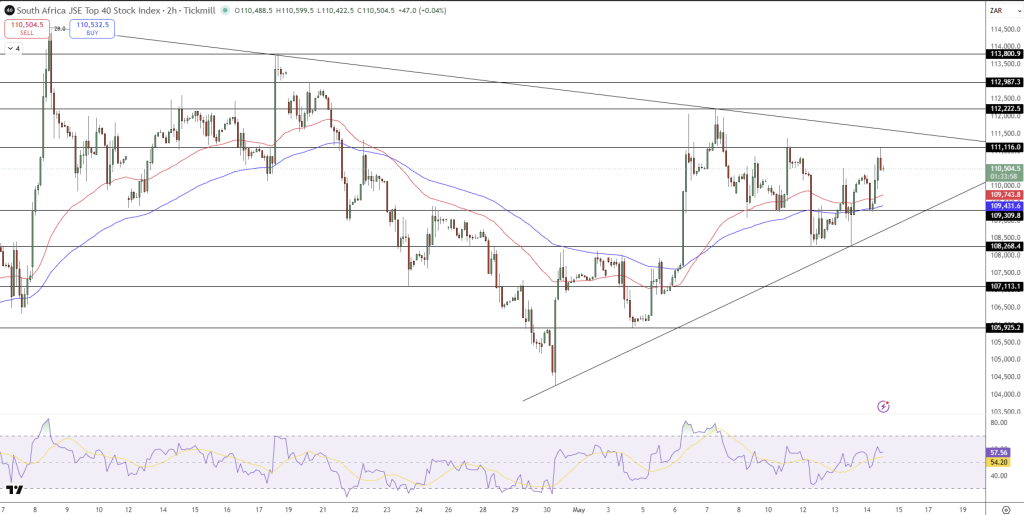
Looking at the bigger picture, that all suggests that it’s going to keep going up – at least in the near term. Our indicators are also looking pretty healthy – the RSI is climbing back up towards 50-55, and even on the dip it started showing some positive divergence – indicating that the sellers are starting to lose their grip. Next to watch for is 111,336 then 113,770.
Key Levels:
- Resistance: 111,336 → 113,770
- Support: 108,248 → 106,054
Trade Idea : Buy above 110,600, aiming for 111,336-113,770, with a stop below 108,248. With all the uncertainty about what’s going to happen internationally, the JSE’s mining-heavy make-up is actually giving it a bit of an advantage when it comes to precious metals and energy.
- Check out our free forex signals
- Follow the top economic events on FX Leaders economic calendar
- Trade better, discover more Forex Trading Strategies
- Open a FREE Trading Account
- Read our latest reviews on: Avatrade, Exness, HFM and XM
Related Articles


Sidebar rates
Related Posts
