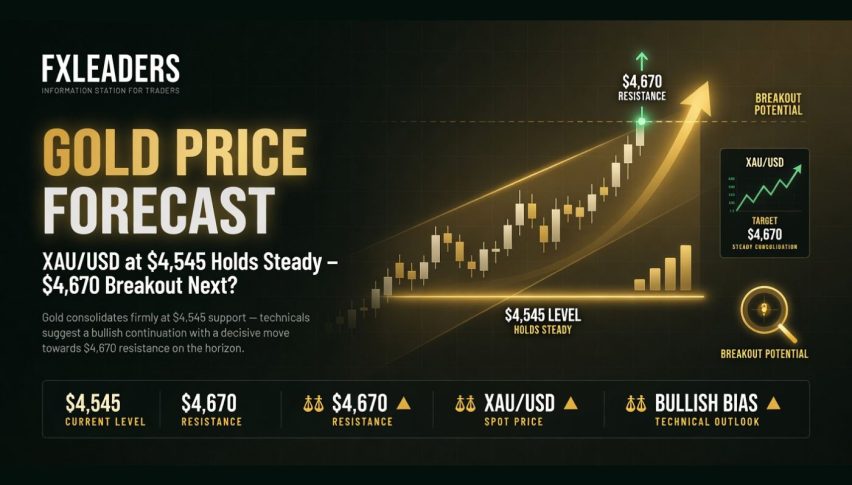
Gold Price Forecast: XAU/USD at $4,545 Holds Steady – $4,670 Breakout Next?
On May 18, 2026, spot gold (XAU/USD) was quoted near $4,545.28 per ounce, edging 0.10% higher in sideways action.
Quick overview
- Spot gold (XAU/USD) was quoted near $4,545.28 per ounce, showing a slight increase amid sideways trading.
- April CPI data exceeded expectations, leading to a stronger dollar index and higher yields, while tempering interest-rate cut expectations.
- China's central bank continues to accumulate gold reserves, reflecting a trend among other central banks amid rising geopolitical uncertainty.
- A recent U.S.-Iran ceasefire is holding, but its long-term viability remains uncertain as trade discussions between the U.S. and China continue.
On May 18, 2026, spot gold (XAU/USD) was quoted near $4,545.28 per ounce, edging 0.10% higher in sideways action.
Highlights:
- April CPI data beat expectations: Headline CPI climbed 3.8% YoY, marking the fastest annual rate seen in almost three years. Core CPI also printed above expectations, tempering expectations of further interest-rate cuts at the FOMC meetings this year, which bolstered the dollar index (DXY) and raised yields across the board.
- U.S.-Iran ceasefire continues: The tenuous U.S.-Iran ceasefire agreement is still holding, now more than six weeks old. Tankers have been permitted through the Strait of Hormuz. But it still remains to be seen whether the deal can hold on all counts.
- PBOC keeps buying: China’s central bank is continuing to hoard the yellow metal, buying reserves for well over 17 consecutive months. Other central banks have also been increasing their allocations.
- Trump meets with President Xi in Beijing: On the trade issue, tariffs and other trade restrictions on China, rare earth minerals, technology transfers to China, and whether there is any room for cooperation on Iran were all on the agenda.
XAU/USD Technical Analysis
On the 2H chart, gold printed a bullish hammer signal after testing the black trendline drawn from early-May lows around $4,351 and the green horizontal price zone ranging from $4,510 to $4,540. Above it, the blue dynamic MA support ranges from $4,644 to $4,672.
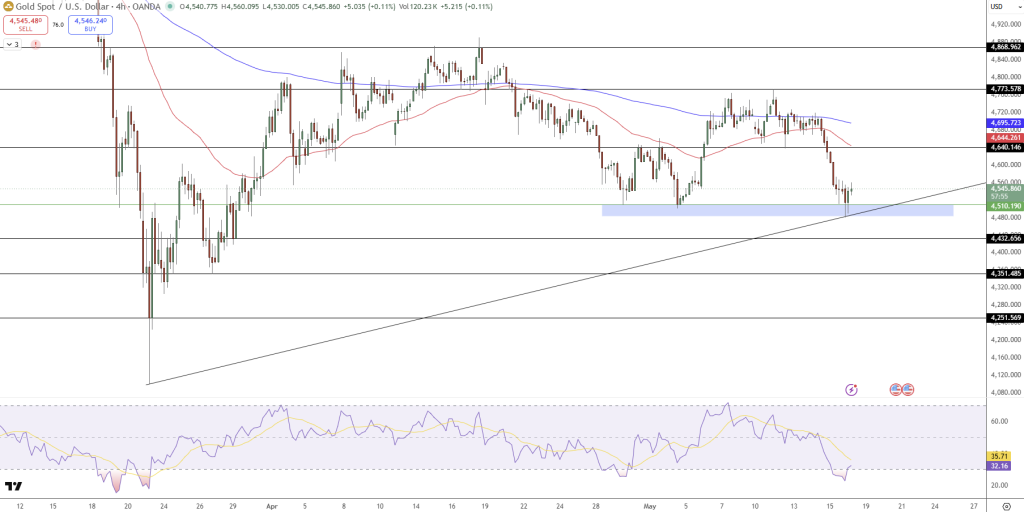
The red dynamic MA overhead ranges between $4,773 and $4,868. Price has retraced inside the parallel ascending channel and established higher lows. The green leg in April pushed the price above the 0.618 Fib level before the recent flag consolidation supported off the 0.382 Fib level. The RSI indicator is hovering at the neutral level (40-50) with a bullish divergence on the pullback.
Key Levels:
- Resistance: $4,672 → $4,773 → $4,868
- Support: $4,510 → $4,432
Trade Idea: Long above $4,560 targeting at $4,672 to $4,773 and stop below $4,510.
Gold trades in the midst of consolidation after a geopolitical tailwind began to dissipate while a more challenging economic picture emerged in light of the hotter-than-expected inflation data. A successful U.S.-Iran deal is seen as a positive step in that regard. But it’s too early to tell what lies ahead for the yellow metal in the short term.
On a bigger picture, the central bank’s buying is likely to continue as more countries look to diversify their holdings as geopolitical uncertainty intensifies, while the safe-haven and inflation hedge attributes of the yellow metal make it appealing to risk-averse investors.
- Check out our free forex signals
- Follow the top economic events on FX Leaders economic calendar
- Trade better, discover more Forex Trading Strategies
- Open a FREE Trading Account
- Read our latest reviews on: Avatrade, Exness, HFM and XM
Related Articles


Sidebar rates
Related Posts
