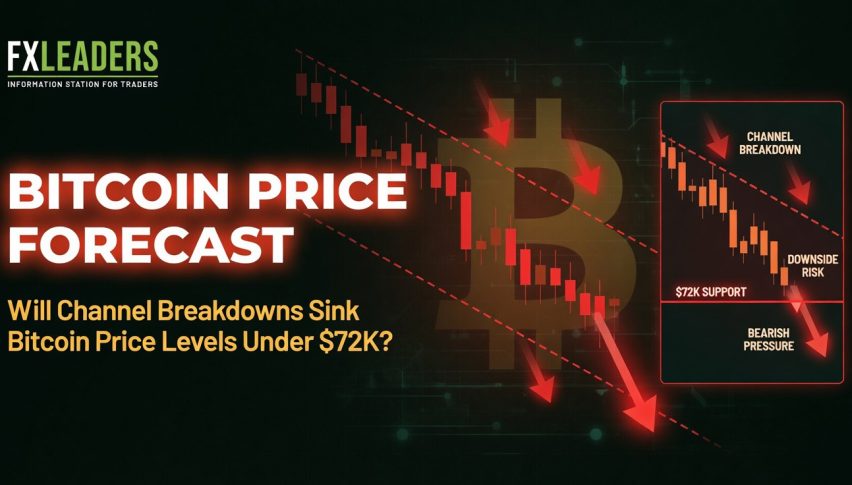
Bitcoin Price Forecast: Will Channel Breakdowns Sink Bitcoin Price Levels Under $72K?
After a 3.99% multi-session liquidation phase in Bitcoin, the leading cryptocurrency by market cap is at $73,300.00...
Quick overview
- Bitcoin has reached a new six-week low at $73,301.00 following a 3.99% multi-session liquidation phase.
- Significant sell-offs in Bitcoin's US spot ETFs, particularly BlackRock's IBIT fund, have contributed to the decline.
- Resurgent conflicts in the Middle East and a restrictive macro policy backdrop are causing investors to seek safer assets.
- The short-term outlook for Bitcoin suggests a continued structural correction, with traders advised to avoid buying until prices stabilize.
After a 3.99% multi-session liquidation phase in Bitcoin, the leading cryptocurrency by market cap is at $73,301.00. Bitcoin is now at a new six-week low, and it has broken important, internal technical levels on its intraday charts due to aggressive institutional ETF outflows and a structurally hawkish global monetary regime. Read on for the key factors driving Bitcoin’s decline today.
Factors driving the BTC sell-off today
- Historic Spot ETF outflows: Wall Street’s institutional funds are seeing significant sell-offs. Bitcoin’s US spot ETFs saw a sharp uptick in net outflows. BlackRock’s IBIT fund, in particular, recorded its second-largest single-day net redemptions of all time.
- Resurgent Middle East conflicts: The US and Iran exchanged military strikes last week, dashing hopes for a permanent extension of the ceasefire that’s been ongoing for the last eight weeks. Investors rotated out of crypto assets to seek other investment safe-havens.
- Restrictive macro policy backdrop: Investors remain cautious on global inflation, as April’s headline CPI was 3.8%. Fed Governor Lisa Cook said on Friday, she is comfortable with raising interest rates if needed under Chair Kevin Warsh. She said that would keep Treasury yields up as a result.
Bitcoin (BTC/USD) technical analysis
The Bitcoin (BTC/USD) 4h price chart shows the asset is trading inside a highly bearish, multi-week price trend. Bitcoin has been in a price downtrend since last week’s peak of $83,350.00, within a highly structured, downward sloping parallel trendchannel.
Bitcoin is currently trading below the 0.236 price retracement level at $73,889.00, with price candles now red across the board.
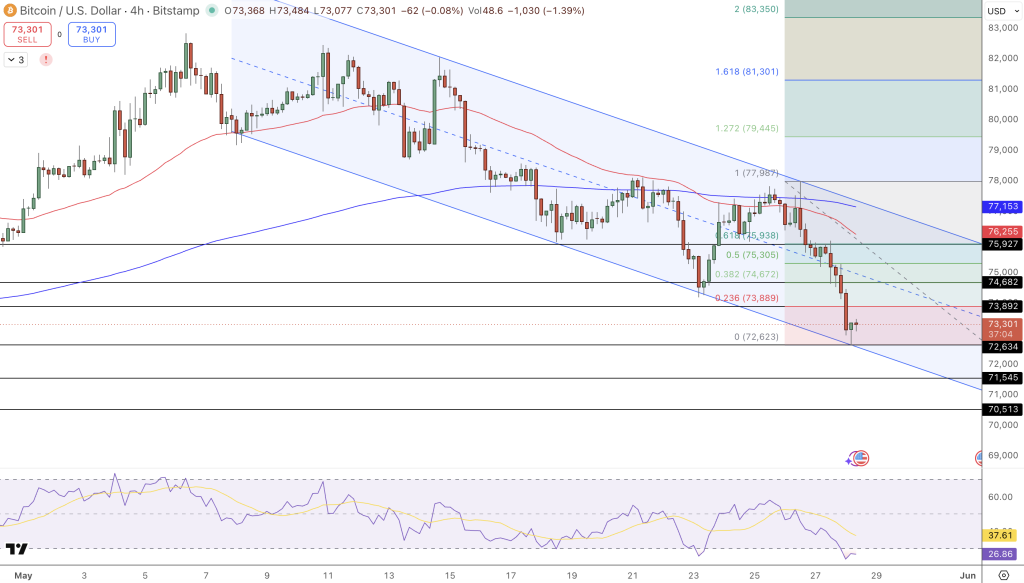
The Bitcoin (BTC/USD) 14-period relative strength index (RSI) has reached oversold territory at below 26 and above 37, with long bear wicks indicating some initial buyer absorption and exhaustion in selling around the $73,000.00 price. Meanwhile, the asset remains suppressed by key overhead price resistance levels including major moving averages.
Key price resistance levels (above current price action):
- $73,889.00 (price floor broken by the 0.236 price retracement level)
- $74,672.00 (0.382 price retracement level)
- $75,305.00 (a price trend line, which has now acted as price resistance)
Key price support levels (below current price action):
- $73,000.00 (psychological level)
- $72,623.00 (0.0 price floor, or “fair value gap”)
- $70,000.00 (medium-term demand level)
Bitcoin trade idea
Here’s a trend following breakout strategy as a result of recent price action below some key horizontal price support levels.
Trade idea:
- Sell Stop, once BTC/USD’s 4h candle closes below $73,200.00.
- Take-profit 1 (T1): $72,623.00
- Take-profit 2 (T2): $71,500.00
- Stop-loss: $74,672.00
Bitcoin price outlook
The short-term outlook for Bitcoin (BTC/USD) is for the cryptocurrency to move through an intense structural correction. While some investors will continue to be bullish on long-term Bitcoin demand and the scarcity of new Bitcoin supply as a result of the crypto asset’s next halving, the next BTC price rally is likely not going to come anytime soon.
Investors will not want to catch any “falling knives” when it comes to this asset’s price decline. In the meantime, traders should avoid buying BTC/USD if its price rallies back to the $74,000.00 price level.
- Check out our free forex signals
- Follow the top economic events on FX Leaders economic calendar
- Trade better, discover more Forex Trading Strategies
- Open a FREE Trading Account
- Read our latest reviews on: Avatrade, Exness, HFM and XM

Related Articles


Sidebar rates

Related Posts
 Save
SaveAva