Silver Price Forecast: $58 Target Open as Industrial Edge Fails Pre-CPI Test
Silver is technically experiencing a violent washout. On Wednesday morning June 10, 2026 spot silver prices plunged to the downside...

Quick overview
- Silver prices have sharply declined, breaking significant support levels to around $63.95 an ounce amid aggressive liquidation by commercial derivatives desks.
- Traders are unwinding positions ahead of the May CPI report, which is expected to create volatility in global markets and influence Federal Reserve interest rate decisions.
- Despite strong physical fundamentals for silver, including a multi-year structural deficit, the current macro environment and technical analysis suggest a bearish outlook in the near term.
- Short-side traders are advised to consider positions on intraday rallies, targeting lower price zones while managing risk with strict stop-loss levels.
Silver is technically experiencing a violent washout. On Wednesday morning June 10, 2026 spot silver prices plunged to the downside with force, breaking through significant horizontal support levels to trade close at around $63.95 an ounce. Commercial derivatives desks are aggressively liquidating length amid an overwhelmingly restrictive macro backdrop that completely overwhelms physical green-technology demand.
Traders are currently looking to unwind their positions ahead of the May Consumer Price Index (CPI) report, released at 8:30AM ET by the U.S. Bureau of Labor Statistics, which will likely create substantial directional volatility in global macro markets. Wall Street pre-market volatility is a result of the rapid recalibration of interest rate expectations following Friday’s surprise nonfarm payrolls report which added 172,000 jobs to the U.S. economy and afforded new Federal Reserve chair Kevin Warsh with greater flexibility heading into the upcoming FOMC meeting on June 16-17. The consensus now is that if the market opens today hot, the Fed will raise rates rather than cut.
In tandem with these macro headwinds, there is also the issue of a brewing conflict in the Persian Gulf that has disrupted the 10-week old truce with a renewed barrage of missile exchanges between the Iranian military and a regional defense force. Normally in these times of market panic one sees bids come into safe-haven assets such as the U.S. Dollar Index, but in this case there is a risk of a long-term hawkish Fed which is sending the U.S. Dollar Index soaring and draining the bid flow in non-yielding hard assets.
Wall Street Expectations
According to the majority of sell-side research banks, underlying consumer prices remain highly persistent, particularly due to soaring maritime insurance costs and the surge in energy costs.
- Headline Inflation: There is an expectation for a substantial jump in year-over-year CPI to 4.2% from 3.8% in April, marking the fastest expansion pace in over three years.
- Core CPI: Underlying core CPI is likely to come in slightly higher at 2.9% YoY excluding the volatile components of energy and food.
- Implications for Chair Warsh: While these types of prints give Chairman Warsh plenty of ammunition to argue against rate cuts, there is a real risk that high inflation may further reduce corporate spending on green technologies and manufacturing equipment.
That being said, the physical fundamentals for silver remain incredibly strong. According to Silver Institute estimates the global silver market remains in a multi-year structural deficit as industrial usage from solar PV, electronics in EVs, and electric grids powering next-gen AI computing continue to surge. The problem of supply is that around 70% of silver production is actually a co-product from copper and zinc mines which can’t be easily turned on and off, leaving global inventories to remain in an extremely tight state.
Silver (XAG/USD) Technical Analysis: Channel Collapse Puts Sellers Back in Charge
Dropping macro fundamentals in favor of the daily timeframe, a powerful, multi-month consolidation framework on silver has now violently collapsed and has presented a golden arena for the big money short-side crowd to play on.
Floor of the Channel Breach
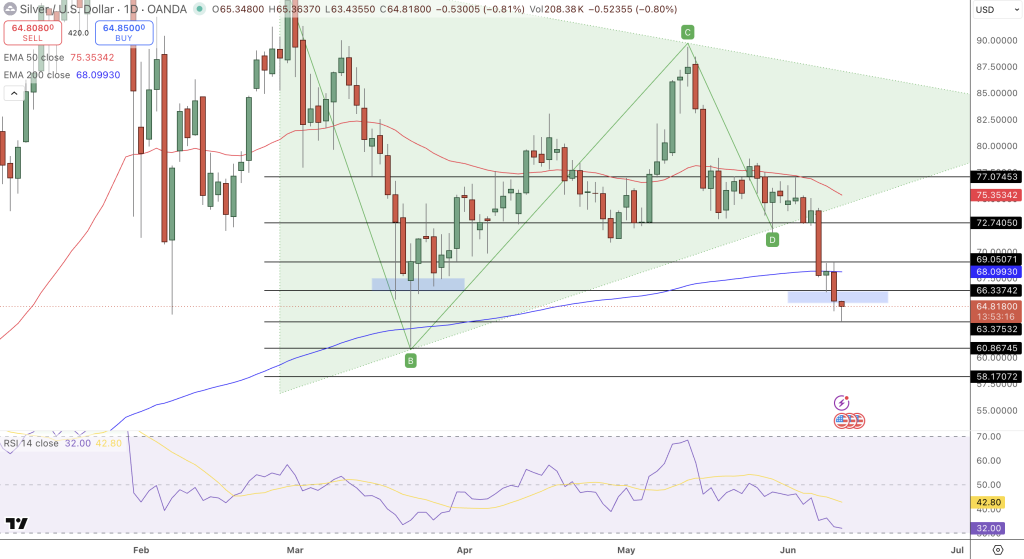
Silver has decisively broken the daily chart’s lower channel support line on the multi-month descending channel structure ($63.95). Sellers have successfully cleared the buy-side physical support floor and the intermediate-term trend has been altered.
Dense Overhead Resistance Layers
With the price previously turned down on multiple occasions in the $75/$77 zone along the upper channel resistance lines, the spot price has dropped down considerably below its 50-day Exponential Moving Average (EMA50) at $75.35 as well as its key 200-day support floor ($68.10). Since both moving averages are tilting down, they are now acting as a strong barrier on the upside against any intra-week retracement rallies.
Trade Plan
The 14-day RSI has dropped hard to 32 in oversold territory. There is no apparent divergence in structure at the recent price lows. Aggressive short-side traders can look to place short positions into any intraday price rally back up into the $68.10 area near the EMA200 with a stop-loss anchored strictly above the overhead horizontal resistance zone at $72.00. The initial technical target is down to the $61.28 to $58.87 zone, before extending into the $57.15 primary support base.
In the end, silver is just going back to its normal technical and macro equilibrium. Although the reality of an enduring, multi-year physical deficit means there are long-term investors who will view this price decline as a bargain, the near-term prices will remain in this technical breakdown zone on the downside ahead of this afternoon’s inflation data flash.
- Check out our free forex signals
- Follow the top economic events on FX Leaders economic calendar
- Trade better, discover more Forex Trading Strategies
- Open a FREE Trading Account
- Read our latest reviews on: Avatrade, Exness, HFM and XM
Related Articles


Sidebar rates
Related Posts
Ava

