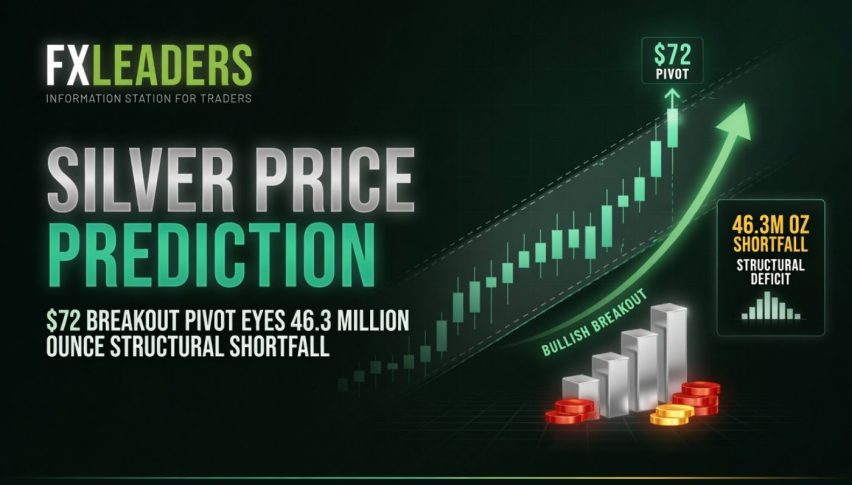
Silver Price Prediction: $72 Breakout Pivot Eyes 46.3 Million Ounce Structural Shortfall
The silver sector is engaged in a high-stakes, basic battle, as the recent downward price liquidation is being consolidated...
Quick overview
- The silver market is facing a significant supply shortage, with spot prices consolidating at $66.75/oz amid heavy macroeconomic pressures.
- The Silver Institute's report indicates a sixth consecutive year of structural supply deficit, expected to widen by 15% in 2026.
- Industrial demand for silver has decreased due to rising costs, but retail coin and bar demand has increased by 18%.
- Technical analysis suggests silver is poised for a breakout, with key resistance levels at $68.68 and support at $65.76.
The silver sector is engaged in a high-stakes, basic battle, as the recent downward price liquidation is being consolidated into a physical supply shortage with historic characteristics. At the Friday, June 12, 2026, spot silver prices managed to establish a steady intraday consolidation pattern during the afternoon sessions to trade at $66.75/oz.
The derivatives markets have been under heavy macroeconomic selling pressure due to this week’s inflation figures out of Washington, but the underlying physical supply of the precious metal has managed to establish a hard structural baseline. In this way, commercial demand has continued to eat up the floating supply, turning the metal into a potential springboard for technical buyers.
The key fundamental underpinning of the session’s structural buy baseline has been the latest data from the Silver Institute’s annual World Silver Survey. The annual report confirmed that the global silver market remains on its sixth consecutive year of structural supply deficit, with the 2026 expected to widen by about 15% to 46.3 m/troy oz.
Since most of the world’s annual silver production is recovered as a by-product of the mining of copper, lead and zinc, primary miners simply do not have the potential to increase output to meet the supply side of silver’s structural deficit. This has been draining physical supply from above-ground vaults at a COMEX and London bullion market since 2021. Over 762 m/troy oz have been withdrawn to commercial demand in this period, with the result of a thin liquidity in the physical bullion market.
While this has helped in keeping an upward bias to industrial silver demand from its all-time high, it has forced industrial solar photovoltaic panel manufacturers to thrift their silver paste consumption by 19%, easing aggregate industrial fabrication demand down to a four-year low of 639.6 million ounces. The demand loss was offset by a rise in physical retail coin and bar demand of 18% plus a rise in high-performance AI data center construction and maintenance demand.
Solar Thrifting Collides with a 6.5% PPI Reality Check
The Bureau of Labor Statistics revealed the annual producer price index (PPI) jumped to a toasty 6.5% year over year in May on final demand goods, including a 2.8% leap in raw energy inputs:
- The “Hawkish Warsh” Regime: Arriving on the heels of Wednesday’s 4.2% consumer inflation shock, the blistering wholesale metric provides newly sworn-in Federal Reserve Chair Kevin Warsh with expansive policy cover heading into the June 16-17 FOMC meeting.
- The Drag on Paper Markets: Fixed-income traders have maintained their hedging positions due to the likelihood of a higher-for-longer Federal reserve baseline, keeping the path for a higher real-Treasury Yields rate and U.S. Dollar higher. This has weighed on non-yielding assets.
- The Rebalance of Industrial Demand: While a higher spot price has forced solar photovoltaic panel manufacturers to thrift their use of the metal in silver paste by 19% to 639.6 m/troy oz over the past year, the resulting loss is offset by a 18% rise in physical retail coin and bar demand.
Silver (XAG/USD) Technical Analysis: The 4H rebound is attempting to retest the descending channel ceiling.
Having moved past the long-term supply deficit, attention should turn to the 4H chart, in which silver’s correction looks to have finished a well-organized retest of nearby demand zones, thus allowing tactical traders to identify a number of directional triggers.
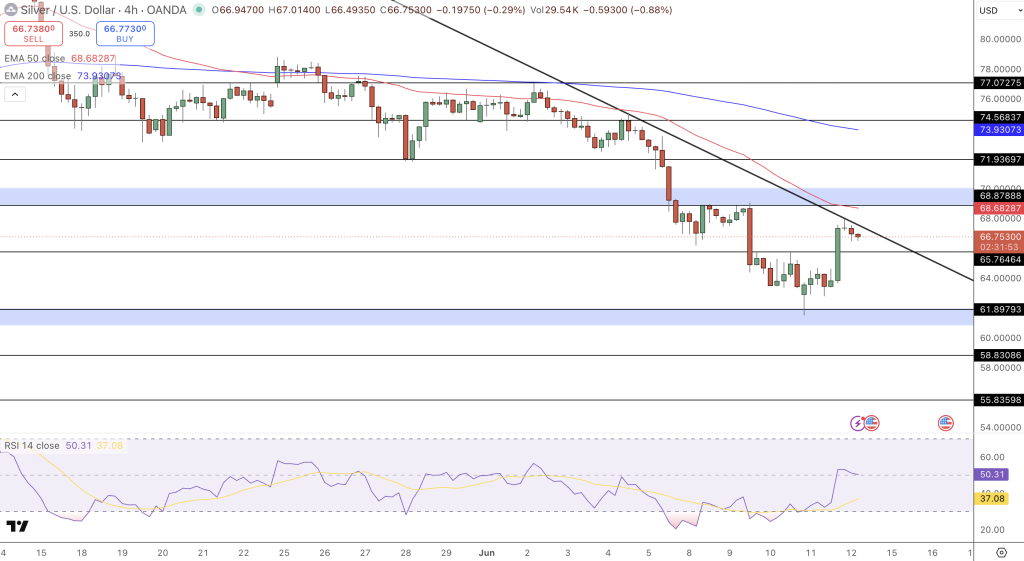
- The Channel Intersection: After a technical flush down to the most recent local bottom around $61.90, the 4H bullish rebound volume bar was able to pick up the tab. $66.75 has begun to consolidate under the top of the black descending channel.
- Supply Stacks Above: The rebound still has a number of technical hurdles to clear before it can resume a strong move higher: $66.75 is still below the 50 EMA ($68.68) which itself is sloped lower, while the 200 EMA sits at $73.93 further away above.
- The RSI Reset: The 14-period RSI has fallen back from oversold to exactly 50 to mark that sellers do not have any more steam to continue the down trend, but that buyers also do not have enough strength to push through the ceiling at $68.68.
- Tactical Entry Points: The market looks to be waiting for one of two breakouts to determine a longer-term bias:
- 1. Bullish Scenario: The 4H close above the 50 EMA and $68.68 resistance to initiate longs to test the recent local high at $71.94, with a 4H close back below $65.76 as a stop.
2. Bearish Scenario: The 4H candlestick close below $68.68 to initiate shorts to test the recent local low at $61.90, with a 4H close above $69.50 as a stop. This will remain in place, should the U.S. Dollar resume higher before the U.S. market close this week.
At present, silver is waiting out its breakout move. A paper-futures trading price in volatile mode is expected, so long as a market-disciplined Fed under Chair Warsh keeps on with its tightening, however, silver remains highly coiled for a structural move higher in light of 46.3 million ounces of physical deficit.
- Check out our free forex signals
- Follow the top economic events on FX Leaders economic calendar
- Trade better, discover more Forex Trading Strategies
- Open a FREE Trading Account
- Read our latest reviews on: Avatrade, Exness, HFM and XM
Related Articles


Sidebar rates
Related Posts
Ava

