VELVETUSD Price Forecast: Token Defends $1.375 Fibonacci Base After Massive 306% Aerodrome Migration Rally
Institutional market structures that oversee the alternative decentralized AI layers are exhibiting significant volatility...
Quick overview
- Institutional market structures for decentralized AI layers are experiencing volatility due to ecosystem growth and macro portfolio rebalancing.
- Velvet's token (VELVET) saw a 5.04% decline to $1.59 after a significant profit-taking correction following a 306% rally.
- The migration of Velvet's liquidity to Aerodrome Finance has improved market depth and attracted speculative interest in synthetic pre-IPO trading.
- Despite a hawkish stance from the Federal Reserve, Velvet's fundamentals remain bullish, with potential for a rebound from key support levels.
Institutional market structures that oversee the alternative decentralized AI layers are exhibiting significant volatility as the month ends, caught between swift ecosystem growth and a macro portfolio rebalancing on a larger scale.
Velvet’s (VELVET), the native utility and governance token of the decentralized data infrastructure network, endured a well-deserved profit-taking correction in the latter part of the trading day on Tuesday, June 30, 2026. Over the last 24 hours spot VELVET fell 5.04% to trade at $1.59 USD and currently holds the #69 position on CoinMarketCap, with a highly active day trading volume of $31,311,130 USD.
Aerodrome Liquidity Migration, Synthetic Pre-IPO SpaceX Feature Spark Massive Volatility
The key factor that powered the token’s incredible 306% multi-day rally from its June cyclical lows of ~$0.30 has been a dramatic overhaul of its decentralized liquidity infrastructure. In line with project protocol-specific directives, Velvet was able to fully migrate all its protocol-owned liquidity on Base over to Aerodrome Finance, the largest DEX on the chain.
Now, in moving the entire depth of liquidity into one single high volume, automated venue, the protocol has allowed algorithmic market makers to quote much tighter spreads, fill larger order book sizes and offer deeper market depth on every cross-token trade on the data marketplace.
Additionally, there has been a surge of speculative interest in the ecosystem due to synthetic pre-IPO markets on the project’s dApp being recently enabled. By offering an opportunity for traders to take positions on-chain, on the stock price of large, prominent private aerospace and tech companies before they ever hit the public market, the platform has tapped into an unexploited market of retail trading and has seen a huge spike in trading volume which in turn has led to an increase in on-chain fees generated. With a Total Value Locked (TVL) of just $770,000, it is clear that this uptick is a positive sign and that there is interest, however the current state of affairs suggests that the move was driven by speculative derivatives trading in the early stages, rather than data marketplace activity as such.
The Warsh Doctrine Ramps Up Carry Costs of High-Beta Infrastructure
Adding immediate pressure to the broader crypto market is the heavily restrictive monetary policy implemented by the newly appointed Federal Reserve Chair, Kevin Warsh, following his June 16 to 17 FOMC press conference. Due to stubborn underlying inflationary persistence in the US economy, with core inflation currently reading a sticky 4.1%, Chair Warsh adopted a very tight, data dependant monetarist policy in which all previous dovish forward guidance as well as all previous interest-rate cut projections for fall, were dropped entirely.
Keeping interest rates at their peak and moving the projected path of interest rates in a more elevated direction in the future, the Fed have been able to support a massive, structural, bid on both U.S. treasury yields and the U.S. Dollar Index (DXY). That high risk free rate instantly increases the opportunity cost of holding more volatile crypto tokens, causing systematic macro portfolios to exit speculative positions in other protocols as the global economy adjusts for a stronger USD. This macro headwind coincides with the enactment, in Switzerland, of the U.S.-Iran interim peace agreement (the “Islamabad Memorandum of Understanding”), with the Strait of Hormuz shipping lanes back up to 100%, oil prices are back down to around $70, draining geopolitical inflation hedges out of speculative capital flows into alternative assets.
Technical Analysis: VELVETUSD coiling near ascending channel support
Moving on to technicals, ignoring central banks’ interest rate decision guidance for a moment: VELVET/USD just printed a nice, highly scan-able continuation formation from its recent $2.09 high. The coin is sitting in a major black ascending channel and has been holding a bullish flag structure on a high volume bullish impulsive wave (off the $1.1375 0.618 Fibonacci support shelf) at $1.5900, comfortably higher than the 1.000 Fibonacci structural breakout level.
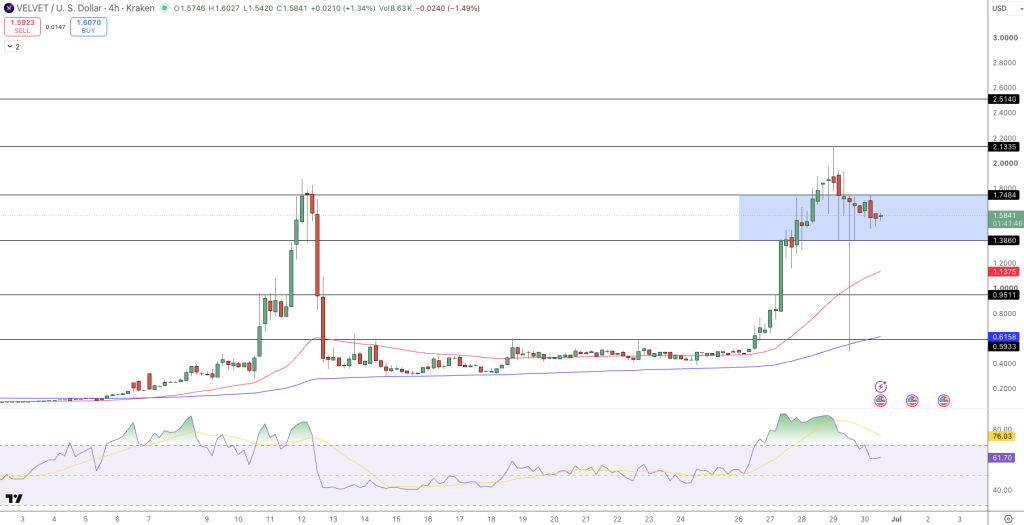
The 14 period RSI has leveled off into a neutral-to-bullish zone at 76.03. While this is in the overbought territory, no divergence has emerged so far and the bullish impulse structure remains intact. The same can be said for the MACD Histogram, which is currently starting to flatten indicating that this initial post-peak pullback is finding a temporary 1.000 Fibonacci extension (at the $1.3750 support zone).
Conclusion and trade idea
With that in mind, Velvets fundamentals are still bullish as they continue to expand their Aerodrome Finance deployment and pre-IPO synthetic trading volumes. Despite Fed Chief Kevin Warsh maintaining a hawkish dollar stance and pushing short-term interest rate hikes for now, the token can be expected to re-bounce from its 1.0000 Fibonacci extension at $1.3750 given that we have an intact bullish channel structure on the 4-hour chart and the hard supply cap of 1,000,000,000 coins.
Tactical Continuation Blueprint
Go long from a retest at the $1.3750 1.0000 Fibonacci extension 4H support level or on a close above the $1.7480 horizontal support level (current resistance). Maintain a stop loss order below the $1.3000 horizontal support level targeting a primary trend-continuation rally back toward the 2.000 Fibonacci extension level at $2.1330, with secondary extensions targeting the macro extension target ceiling at $2.5140.
- Check out our free forex signals
- Follow the top economic events on FX Leaders economic calendar
- Trade better, discover more Forex Trading Strategies
- Open a FREE Trading Account
- Read our latest reviews on: Avatrade, Exness, HFM and XM
Related Articles

Sidebar rates
Related Posts
Ava

