Gold Price Analysis: $4,015 as Renewed US-Iran Strikes and Strait Closure Create a Safe-Haven Paradox
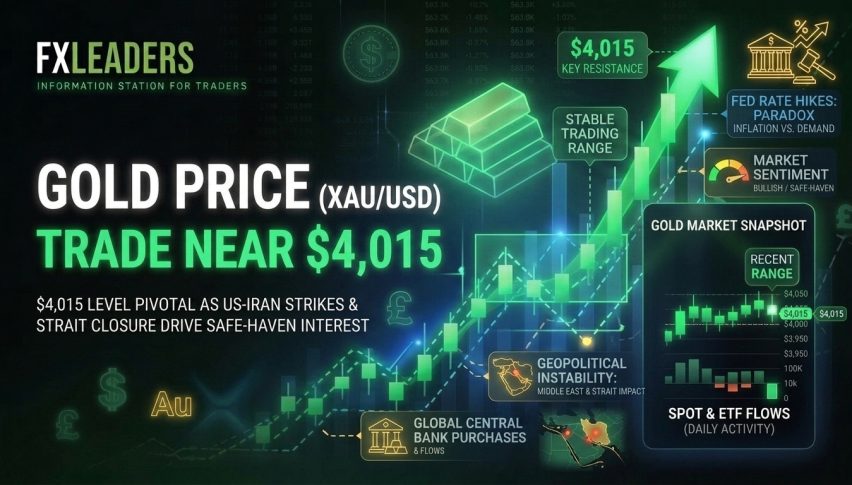
On July 14, XAU/USD is seen trading at $4,017, 2.63% lower from yesterday. The metal is in its lowest spot since July 1 after missile...
Quick overview
- XAU/USD is trading at $4,017, down 2.63% from the previous day, marking its lowest level since July 1 due to geopolitical tensions.
- The closure of the Strait of Hormuz by Iran is driving oil prices higher, which is unexpectedly bearish for gold as it raises inflation and Fed rate hike expectations.
- Gold is currently behaving more like a risk-sensitive asset rather than a safe haven, with critical support at $3,960 and resistance at $4,063.
- Upcoming events, including Warsh's testimony and CPI/PPI reports, will significantly influence gold's price direction this week.
On July 14, XAU/USD is seen trading at $4,017, 2.63% lower from yesterday. The metal is in its lowest spot since July 1 after missile and drone attacks were carried out on both sides over the weekend. Now, Iran has also announced closure of the Strait of Hormuz again. The irony here is that this geopolitical escalation is driving the price of oil higher, instead of gold as it should. And this is what is driving gold down. The Fed hike rate probability has increased, given that oil is an inflationary driver. Warsh testifies this week, ahead of CPI on Tuesday and PPI on Wednesday.
The Safe-Haven Paradox: Why Escalation Is Bearish for Gold Right Now
Over the weekend, the US attacked southern Iran, and Iran launched attacks at US military positions across the Gulf as the Strait of Hormuz, Iran. Oil surged on this news. This should be a buy for gold, but not in July of 2026. This is a sell. As the oil prices rise due to the escalation in the Middle East, it will bring more inflation into the market. This will drive the Fed rate-hike expectations and the US dollar will get stronger, which will drive gold down. As such, the US-Iran tensions are rising after Iran announced Strait of Hormuz closure, which is raising crude oil prices and is lifting Fed rate hike expectations. This is pushing the dollar higher, with risk-averse flows flowing into the greenback, which is pressuring the yellow metal.
As such, gold is trading below $4,050. Geopolitical escalation is a negative catalyst, instead of being an upside catalyst, for the precious metal. This was one of the biggest paradoxes that has been seen in the 2026 gold price action since the beginning of the February war between Iran and the US. For five months now, gold is behaving more like a risk-sensitive asset rather than as a safe-haven.
One exception was the June NFP of only 57,000, against a 110,000 consensus, which dropped the rate-hike probability in September to 50% (from 67%) and lifted the gold price above $4,200 temporarily. The weekend strikes, however, have once again escalated the oil inflation, rate-hike chain. However, the RSI studies have indicated a bullish divergence. This shows that the downside trend may be bottomed-out. Even the MACD also turning positive. It appears like the bears might be losing their way at the psychological $4,000 level.
XAU/USD Technical Analysis: $3,984 Is the Line
Looking at the chart, it appears like XAU/USD is in a descending channel since the peak at $5,400 reached back in February. The 200-period EMA has also been major resistance for the last five months, and is now at $4,063, whereas the spot price is trading at $4,061, keeping it below the downward resistance. This is also seen on the 1-hour chart, where the price is held in a descending channel since the Feb peak.
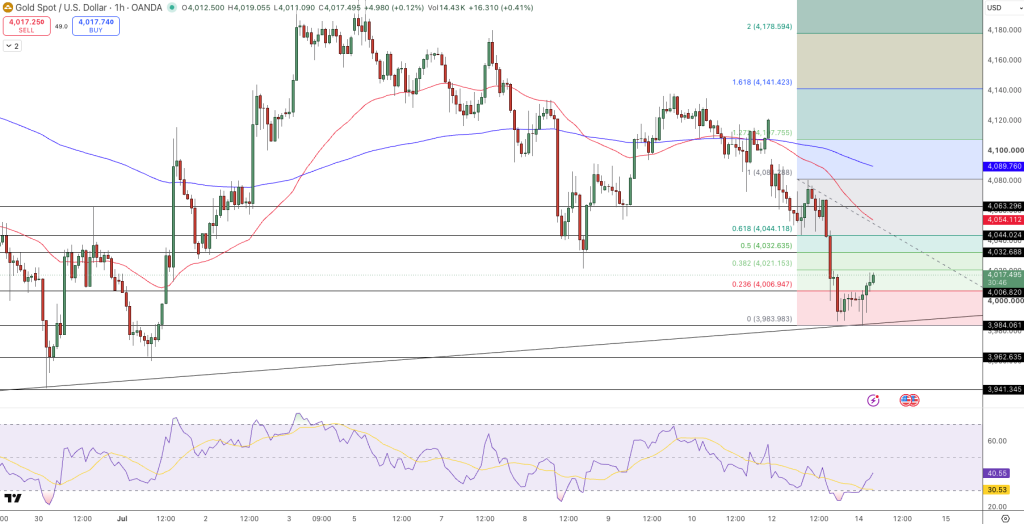
The 200-period EMA is at $4,063, major resistance, with the pair capping below the $4,044 descending trendline (0.236 Fibonacci). This shows a bullish divergence, as we’ve witnessed the last several weeks. RSI has not reached a technical oversold yet.
Resistance: $4,044 (Fibonacci / descending trendline) → $4,054 (Fibonacci) → $4,063 (200-period EMA). Support: $3,984 (channel floor) → $3,962 → $3,941. The $3,960 support is critical. A clear drop below this support is needed to take the metal all the way down to $3,800.
RSI is sitting at 40.55, neutral. There is room below here. MACD is in negative territory but showing early stabilisation.
Buy above $4,044 | Target: $4,054 to $4,063 | Stop below $3,984
The Fed rate-hike rate decision remains in focus. Warsh testifies this week on the timeline. This week’s major catalysts in order of importance is: Warsh Congressional Testimony, CPI (consensus ~3.5% headline) Tuesday, PPI Wednesday and Hormuz diplomatic development.
FAQ: Gold — Strait Closure, Warsh Testimony, and the $3,960 Critical Support
Why is the Strait of Hormuz closure bearish for gold rather than bullish?
The reason is because at the moment, the Hormuz-oil-inflation mechanism dominates the safe-haven effect. Higher oil on closure leads to higher inflation expectations, higher rate-hike expectations, higher dollar, higher yields, and mechanical selling of non-interest-bearing gold. This pattern has held since February 2026; it will only flip if either oil falls for reasons other than geopolitics, or if the Fed signals that it won’t hike in the face of higher energy prices. June’s 57,000 NFP was the first indication of the second possibility; Warsh’s testimony before Congress this week will be the next.
What does Kevin Warsh’s Congressional testimony mean for gold this week?
Warsh testifies alongside CPI and PPI prints this week, which will allow him to either confirm or temper the hawkish rate-hike narrative priced by the market. At Sintra, Warsh refused to provide forward guidance in order to maintain maximum uncertainty in markets. If Warsh continues that stance this week, September rate hike expectations remain just shy of 50% and gold continues to be capped below $4,063. If Warsh instead uses language to the effect that oil-fuelled inflation is “transitory” or that the deterioration in labour markets calls for a more cautious approach, rate hike expectations will fall and allow gold to build the right technical setup to trade above its 200-period moving average.
What is the gold price outlook for July 2026?
Gold could trade between $3,365 and $4,236 in July 2026 with the potential for $3,542 to $3,887 by month-end. JP Morgan remains above $4,500 for the full year in Q4 on rate cuts. Gold could fall to $3,800 if it is unable to maintain the $3,960 to $3,984 support level. If gold trades above $4,300, that would indicate the bullish price structure has been re-inaugurated, though that scenario remains reliant on a diplomatic solution at Hormuz that sends oil prices down or Warsh signalling no hike in September.
- Check out our free forex signals
- Follow the top economic events on FX Leaders economic calendar
- Trade better, discover more Forex Trading Strategies
- Open a FREE Trading Account
- Read our latest reviews on: Avatrade, Exness, HFM and XM

Related Articles

Sidebar rates

Related Posts
 Save
Save