SK Hynix Price Prediction: Is a 39% Correction on the Horizon?
Quick overview
- SK Hynix has significantly benefited from the AI infrastructure boom, with a nearly 60,000% increase in stock value since its historical low.
- Despite a recent correction, the long-term bullish trend remains intact as long as the stock stays above key support levels.
- Momentum indicators show weakening signals, suggesting the correction may extend further, with major support at ₩1,848,000.
- To improve the technical outlook, SK Hynix needs to reclaim the 50-day EMA at ₩2,178,000 and the Golden Ratio level around ₩2,529,000.
SK Hynix has been one of the biggest beneficiaries of the AI infrastructure boom, driven by unprecedented demand for high-bandwidth memory (HBM) chips used in NVIDIA’s AI accelerators. As one of the world’s leading memory manufacturers, the company has emerged as a key supplier to hyperscalers and AI hardware providers, allowing earnings and margins to expand significantly over the past two years.
Investor interest in the company has also increased following the launch of its Nasdaq-listed ADR (SKHY), providing U.S. investors with easier access to SK Hynix shares. While the stock remains in a strong long-term uptrend, technical indicators suggest the recent correction may not be over, with several key support levels now coming into focus.
SK Hynix Stock Has Rallied Nearly 60,000% Since Its Historical Low
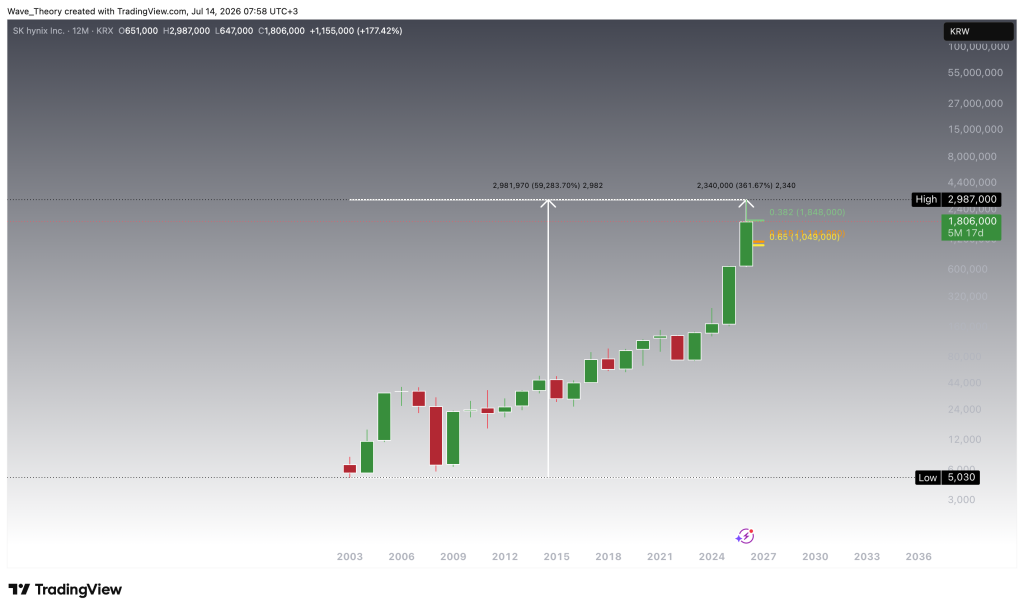
On the yearly chart, SK Hynix has delivered an extraordinary long-term performance, surging almost 59,300% from its historical low of approximately ₩5,030 to an all-time high near ₩2,987,000. This year alone, it surged by almost 362 %.
Following this parabolic advance, the stock has entered a corrective phase while remaining well above its long-term support levels. The first important Fibonacci support sits at the 0.382 retracement near ₩1,848,000, followed by the Golden Ratio support between ₩1,049,000 and ₩1,144,000.
Despite the recent weakness, the long-term bullish market structure remains intact. As long as SK Hynix holds above the Golden Ratio support zone, the primary uptrend remains technically valid.
Monthly Chart Shows Momentum Cooling After a Historic Rally
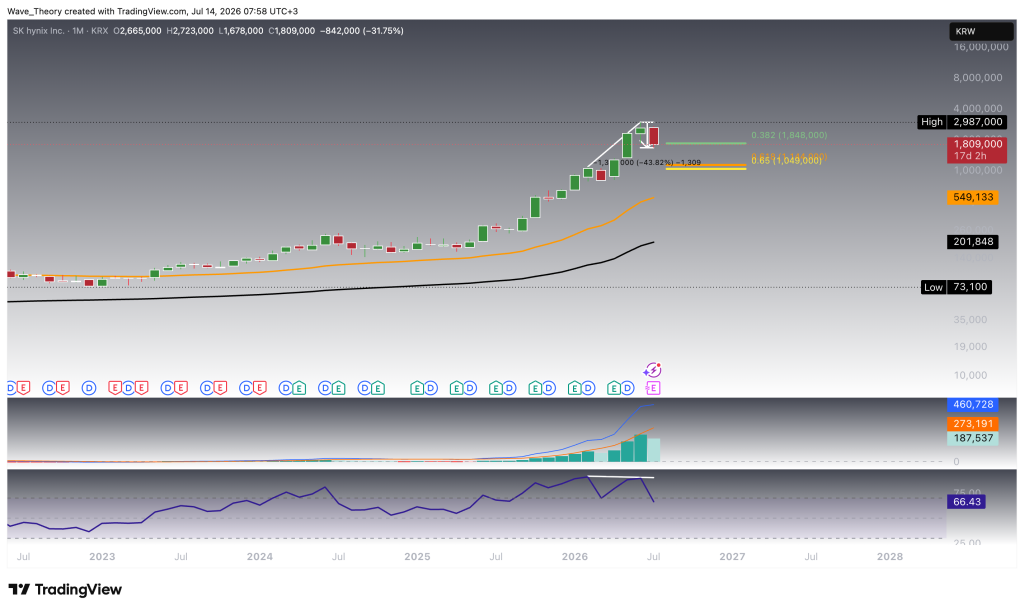
On the monthly chart, SK Hynix has already corrected approximately 44% from its all-time high while continuing to trade well above both the 50-month EMA at ₩549,133 and the 200-month EMA at ₩201,848.
The first major support remains the 0.382 Fibonacci level at ₩1,848,000. If sellers gain further control, the next major downside target lies between ₩1,049,000 and ₩1,144,000, representing the Golden Ratio support zone.
Meanwhile, the MACD remains bullishly crossed despite the recent correction, although the histogram has started ticking lower, signaling weakening upside momentum. At the same time, the RSI has formed a bearish divergence and has fallen back toward 66, suggesting momentum continues to cool after the stock’s parabolic advance. However, the EMAs remain bullishly crossed and continue to confirm the long-term bullish trend.
Weekly Trend Remains Bullish Despite Bearish Momentum
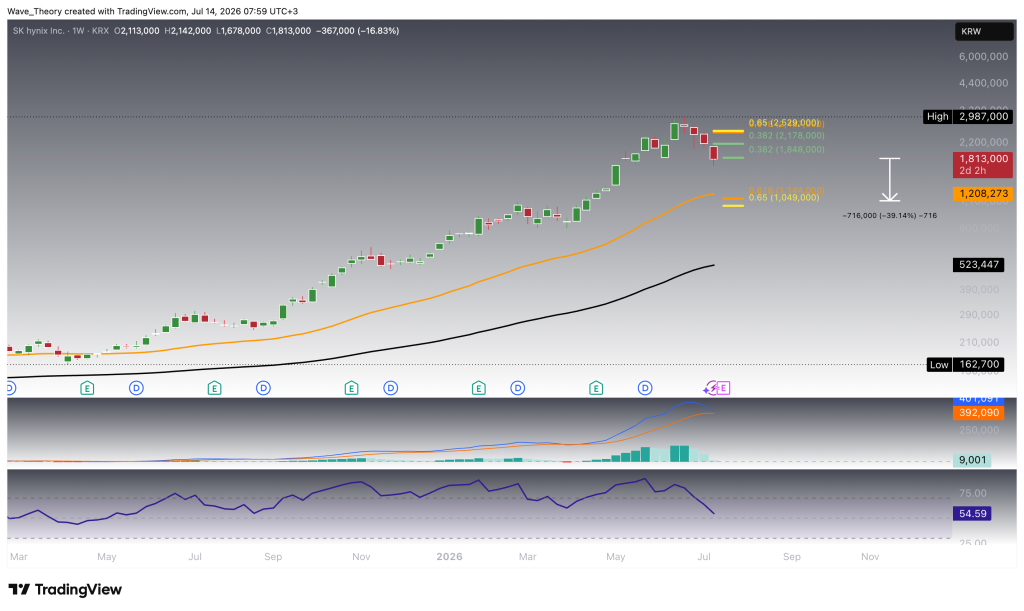
On the weekly chart, SK Hynix continues to trade above both the 50-week EMA at ₩1,208,273 and the 200-week EMA near ₩523,447, confirming that the broader trend remains bullish.
However, momentum has weakened considerably. The MACD histogram continues ticking lower, while the MACD lines are approaching a bearish crossover. Meanwhile, the RSI has fallen into neutral territory near 55, reflecting fading buying pressure. On the bullish side, the golden crossover of the EMAs continue to confirm the trend bullishly in the mid-term.
If the correction extends further, the first important support remains at ₩1,848,000. A break below this level could expose the Golden Ratio support between ₩1,049,000 and ₩1,144,000, representing approximately 39% downside from current prices.
Daily Chart Continues to Favor the Bears
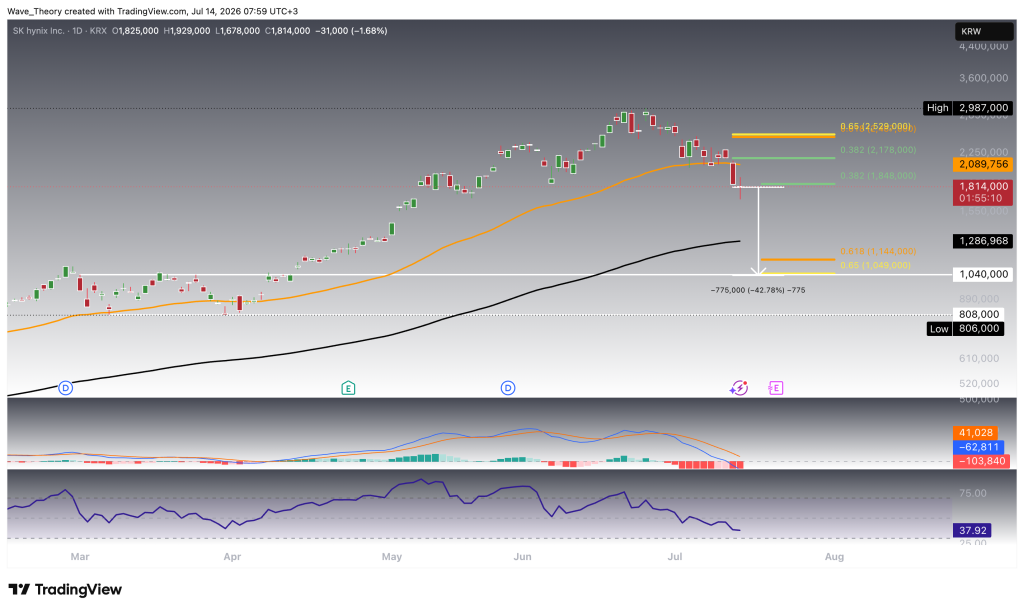
On the daily chart, SK Hynix remains in a clear short-term correction after falling below the 50-day EMA at ₩2,089,756. The stock is currently attempting to stabilize around the 0.382 Fibonacci support at ₩1,848,000.
Momentum indicators continue to favor the bears. The MACD lines remain bearishly crossed, while the MACD histogram continues printing lower values, confirming sustained downside momentum. Meanwhile, the RSI has declined toward 38, approaching oversold territory without generating a bullish reversal signal.
Should the ₩1,848,000 support fail, the next major downside target remains the Golden Ratio support between ₩1,049,000 and ₩1,144,000. Additionally, historical support lies between ₩808,000 and ₩1,040,000 Conversely, reclaiming the 50-day EMA would be the first indication that bullish momentum is beginning to recover.
Moreover, the EMAs display a golden crossover, which confirms the trend bullishly in the short- to medium term.
4-Hour Chart Shows Early Signs of Stabilization
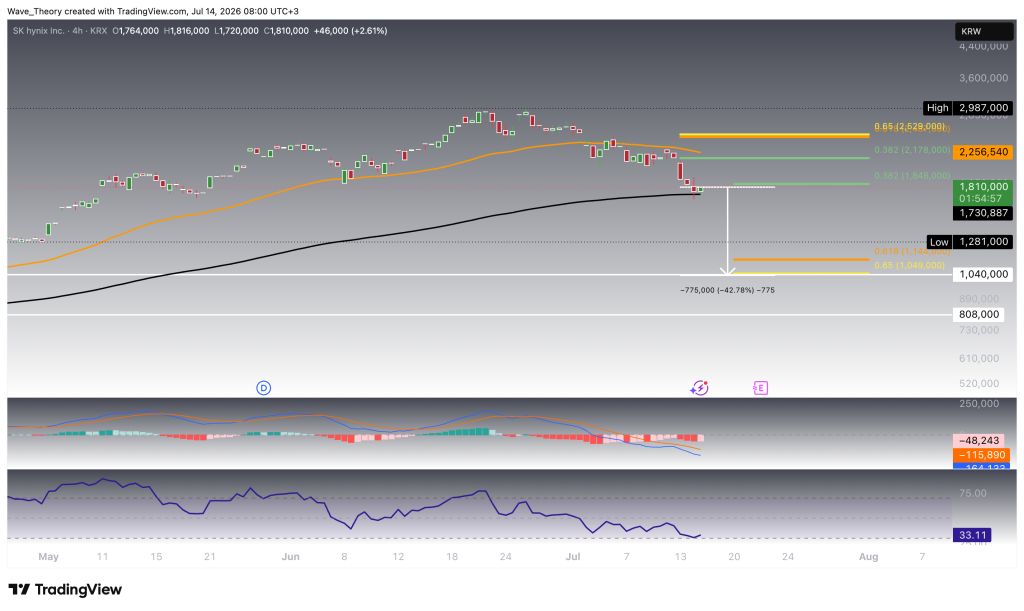
On the 4-hour chart, SK Hynix has started to stabilize around the 200-4H-EMA at ₩1,730,887 after its recent sell-off. Buyers successfully defended the ₩1,848,000 support level, producing a modest rebound over the latest sessions.
However, the short-term trend remains bearish. The MACD lines remain bearishly crossed, although the MACD histogram starts to print bullish values showing early signs of improvement. Meanwhile, the RSI remains weak around 33, indicating sellers still control short-term momentum.
Immediate resistance lies at ₩2,178,000, followed by the 50-period EMA near ₩2,256,540. Above that, the next major resistance sits at the Golden Ratio level around ₩2,529,000. Only a break of the golden ratio level would invalidate the ongoing correction phase. Then, SK Hynix could target the ath at ₩2,987,000 or even surpass it.
SK Hynix Price Prediction: Summary
SK Hynix remains in a strong long-term uptrend despite entering a corrective phase after its historic AI-driven rally. Momentum indicators across the weekly, daily, and 4-hour charts continue to weaken, suggesting the correction could extend further.
The first major support sits at ₩1,848,000. A break below this level would expose the Golden Ratio support between ₩1,049,000 and ₩1,144,000, implying roughly 39% downside. On the upside, the stock must reclaim ₩2,178,000, the 50-day EMA, and eventually ₩2,529,000 to improve the technical outlook. As long as SK Hynix holds above the Golden Ratio support, the broader bullish market structure remains intact.
- Check out our free forex signals
- Follow the top economic events on FX Leaders economic calendar
- Trade better, discover more Forex Trading Strategies
- Open a FREE Trading Account
- Read our latest reviews on: Avatrade, Exness, HFM and XM

Related Articles

Sidebar rates

Related Posts
 Save
SaveAva

