Gold Price Forecast Today: XAU/USD Tests $4,020 Support Ahead of Fed Decision, July 28
Gold retreated towards $4,046 on Tuesday, weighed by a firmer US dollar and growing market expectations of a more aggressive...

Gold retreated towards $4,046 on Tuesday, weighed by a firmer US dollar and growing market expectations of a more aggressive Federal Reserve, which offset a decline in US Treasury yields and firm physical demand from Asia. The market will wait to see whether XAU/USD can maintain the $4,021 support level prior to the Fed’s announcement on Wednesday.
Stronger Dollar and Fed Expectations Pressure Gold
Gold came under fresh pressure on Tuesday ahead of one of the most closely monitored Fed meetings this year. Spot gold traded at $4,045.89 per ounce, while US gold futures were at $4,046.20, as the US dollar stayed near a one-month peak, raising the cost of the precious metal for overseas buyers.
The Federal Open Market Committee started its two-day meeting on 28 July, with its decision due on Wednesday and a press conference by Fed Chair Kevin Warsh. Markets currently expect a 62% chance of the Fed keeping interest rates unchanged and a 38% chance of a 25 basis point rise, according to CME FedWatch data, compared with about a 16% likelihood a week ago. There is also an 81% probability of a September rate hike.
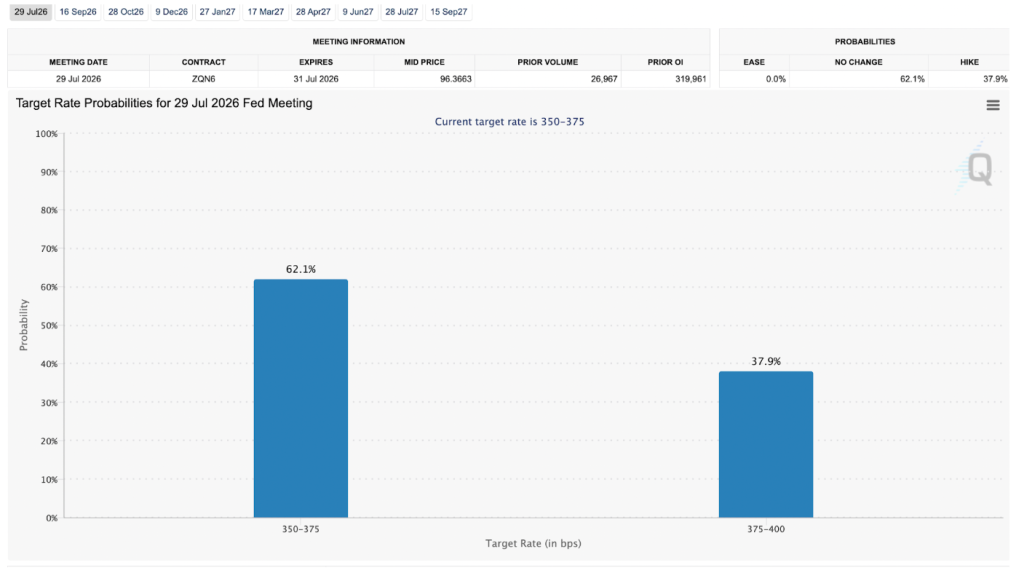
Rising interest rates tend to reduce gold prices because they make the opportunity cost of holding the non-interest-bearing commodity higher and boost the dollar’s value. Even if interest rates remain unchanged this week, a hawkish Fed tone stressing inflation risks could keep a lid on the bullion price.
Geopolitical Risks Ease but Physical Gold Demand Remains Firm
Another factor pushing gold lower has been the softening of tensions between the US and Iran, leading to a decline in the metal’s safe-haven status. Recent talks between the US and Iran have decreased fears of an immediate conflict, contributing to lower oil prices and reduced worries of a potential rise in inflation that could prompt central banks to raise interest rates.
Although gold investment demand in Western countries is weakening, demand from Asia has provided long-term support for the metal.
According to Reuters, China’s net gold imports via Hong Kong doubled in June from a year earlier, while China’s central bank posted its highest monthly increase in gold reserves in more than two years. Such data suggests central bank buying and physical demand remain strong despite gold’s recent weakness.
ETF Outflows Continue, But Asian Investors Support the Market
World Gold Council data shows globally-traded, physically-backed gold ETFs saw net outflows of US$8.9 billion in June, bringing down their total holdings to 4,047 tonnes (down by 74 tonnes) with total assets under management falling to US$526 billion. Most of the outflows were recorded in North America as investors looked for higher-yield assets.
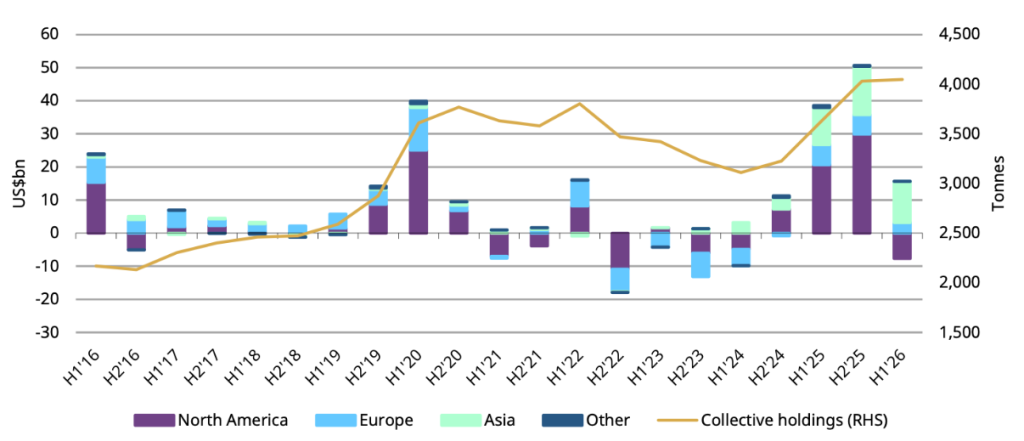
However, the overall outlook for gold has been positive. Globally traded, physically-backed gold ETFs recorded inflows of around US$8 billion in the first half of 2026, with Asian funds recording a record US$12 billion of inflows, reflecting investors’ appetite for portfolio diversification across the region.
On Thursday, the US will release gross domestic product, personal income, spending and core personal consumption expenditure (PCE) inflation data. Stronger economic data could fuel hopes of another Fed rate hike in September, while weaker inflation would reduce pressure on the gold price.
Gold Price Forecast: Can XAU/USD Defend the $4,021 Triangle Floor?
XAU/USD continues to trade within a large symmetrical triangle on the 2H timeframe after it was unable to regain the 50-period EMA at $4,070 and the 200-period EMA at $4,077. This failure to hold above the key moving averages indicates that sellers maintain dominance over the asset in the short term. The RSI reading of 36 also shows that bearish sentiment is increasing but has not yet reached an oversold territory.
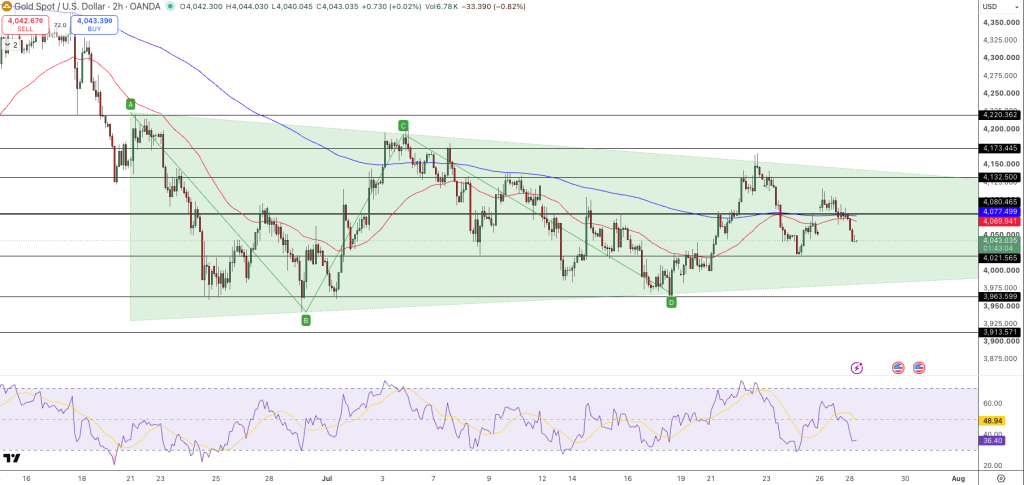
Near-term support is seen at $4,021 with a secondary level at $3,964 (lower border of the triangle). A decisive break below this level would expose $3,914. On the other hand, if bulls reclaim $4,080, the next targets would be $4,133 and $4,173.
If the pair closes above $4,080, it will signal a bullish breakout from the triangle formation, paving the way for $4,220. However, if the price closes below $4,021, it would strengthen the bearish outlook and up the risk of a deeper correction.
Trade Plan
- Bullish plan: Buy after a breakout above $4,080. Target 1: $4,133 Target 2: $4,173 Target 3: $4,220 Stop-loss: Below $4,021
- Bearish plan: A break below $4,021 may result in a drop towards $3,964, followed by $3,914.
FAQs
Why is gold dropping today?
The strengthening of the US dollar in anticipation of the Fed’s rate decision is weighing on gold due to the higher opportunity cost of owning a non-interest bearing asset.
Which Fed outcome would lift gold?
Gold could rise if the central bank maintains rates at current levels and indicates that it doesn’t feel compelled to raise borrowing costs further, while indicating more confidence that inflation is cooling.
Are strong gold prices coming from physical demand?
While Western investors have cut back on their gold ETF positions, buying from Asia remains strong. In addition, China has stepped up its gold purchases and the World Gold Council has noted record first-half inflows into Asian gold ETFs.
- Check out our free forex signals
- Follow the top economic events on FX Leaders economic calendar
- Trade better, discover more Forex Trading Strategies
- Open a FREE Trading Account
- Read our latest reviews on: Avatrade, Exness, HFM and XM

Related Articles


Sidebar rates

Related Posts
 Save
Save