What’s Going on with USD/JPY
Yesterday we pointed out the 112.50 level in USD/JPY. It has been a very strong support level and it has now turned into resistance.
We said that we were waiting for the price to get there, so we could open a sell forex signal. The 50 SMA was standing right there, so it made that level even more important.
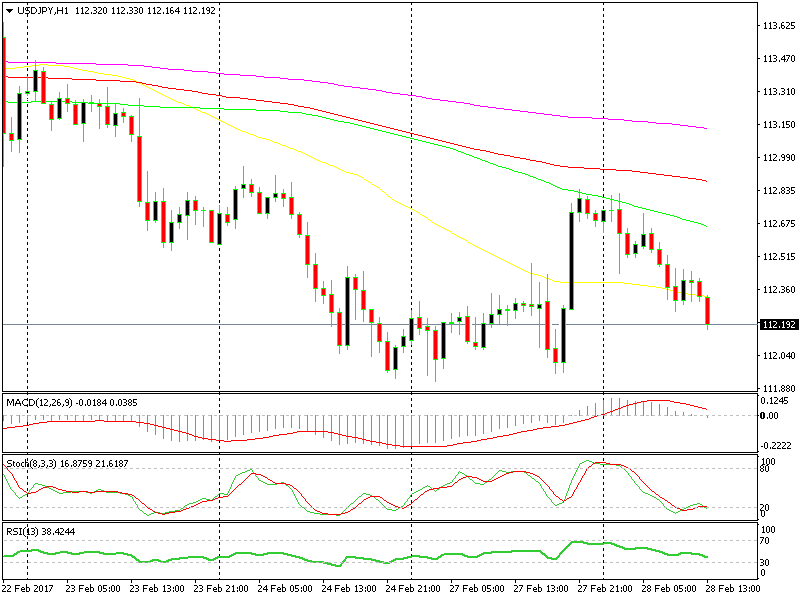 We could have made quite a few pips had we sold below the 50 SMA
Looking at the hourly USD/JPY chart, we can see that there were 3 flagrant opportunities to sell this forex pair up there. We missed them all and I´m still beating myself up about that, particularly after highlighting that level. At least, we put it up there for you guys, so I hope you took at least one shot at it yesterday.
Then, in the evening this forex pair jumped about 90 pips, where it came across the 100 SMA on the same timeframe chart. It has been sliding relentlessly since then, but it seems to have stalled right now, about 10 pips above 112.
This might be a good place for a small scalp, but the H4 chart looks sort of dangerous for longs. It´s heading down and it´s still midway, so there´s plenty of room on the downside. By the way, Trump is coming later today, so I don´t expect much action until then.
- Check out our free forex signals
- Follow the top economic events on FX Leaders economic calendar
- Trade better, discover more Forex Trading Strategies
- Open a FREE Trading Account
- Read our latest reviews on: Avatrade, Exness, HFM and XM

Related Articles



Sidebar rates

Related Posts
 Save
Save