Prices Forecast: Technical Analysis
For today, NEAR Protocol is predicted to close at approximately $1.52, with a range between $1.48 and $1.55. Looking ahead to the week, the expected closing price is around $1.54, with a range of $1.50 to $1.58. The technical indicators suggest a moderately bullish sentiment, as the RSI is at 56.84, indicating that the asset is neither overbought nor oversold. The ATR of 0.08 suggests low volatility, which may lead to a more stable price movement in the short term. The price has been trading above the pivot point of $1.52, which is a positive sign for potential upward movement. Resistance levels at $1.55 and $1.59 could act as barriers, while support at $1.48 provides a safety net. Overall, the combination of these indicators suggests a cautious optimism for NEAR Protocol’s price in the coming days.
Fundamental Overview and Analysis
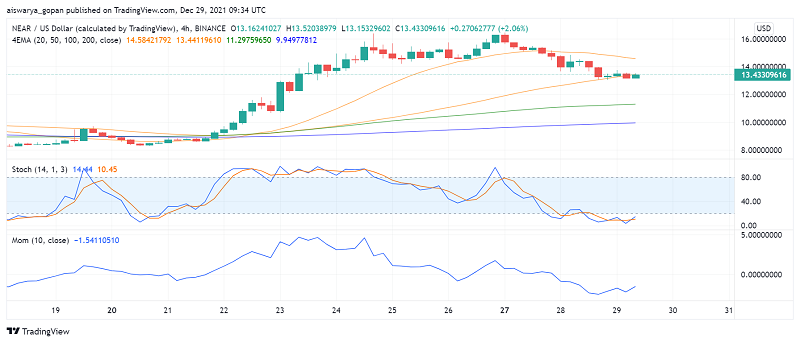
NEAR Protocol has shown a consistent upward trend in recent weeks, with prices recovering from previous lows. Factors influencing its value include increasing adoption in decentralized applications and a growing developer community. Investor sentiment appears positive, driven by recent technological advancements and partnerships that enhance its scalability. However, challenges such as market volatility and competition from other blockchain platforms remain. The asset’s current valuation seems fair, considering its potential for future growth, but caution is advised due to the unpredictable nature of the crypto market. Regulatory changes could also impact its performance, making it essential for investors to stay informed about the evolving landscape.
Outlook for NEAR Protocol
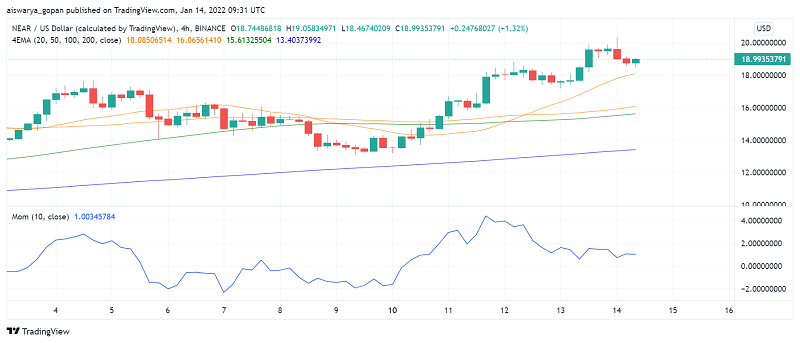
The future outlook for NEAR Protocol appears promising, with ongoing developments in its ecosystem likely to drive demand. Current market trends indicate a bullish sentiment, supported by historical price movements that show resilience. In the short term (1 to 6 months), prices may range between $1.50 and $1.70, depending on market conditions and investor interest. Long-term projections (1 to 5 years) suggest potential growth, with prices possibly reaching $2.00 or higher if adoption continues to rise. However, external factors such as geopolitical events or significant market corrections could pose risks. Investors should remain vigilant and consider both opportunities and challenges as they navigate the market.
Technical Analysis
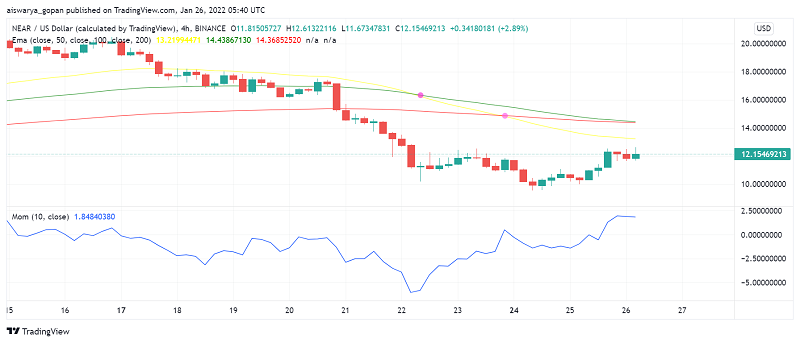
Current Price Overview: The current price of NEAR Protocol is $1.515, slightly down from the last closing price of $1.515. Over the last 24 hours, the price has shown minor fluctuations, indicating low volatility. Support and Resistance Levels: Key support levels are at $1.48, $1.44, and $1.40, while resistance levels are at $1.55, $1.59, and $1.63. The pivot point is $1.52, and the asset is currently trading just above this level, suggesting a bullish outlook. Technical Indicators Analysis: The RSI is at 56.84, indicating a neutral trend, while the ATR of 0.08 suggests low volatility. The ADX is at 35.53, indicating a strong trend. The 50-day SMA is at 1.4463, and the 200-day EMA is at 1.4047, showing no immediate crossover. Market Sentiment & Outlook: Sentiment is currently bullish, as the price is above the pivot point, and the RSI indicates potential for upward movement.
Forecasting Returns: $1,000 Across Market Conditions
The table below outlines potential investment scenarios for NEAR Protocol, providing insights into expected price changes and estimated returns.
| Scenario | Price Change | Value After 1 Month |
|---|---|---|
| Bullish Breakout | +10% to ~$1.67 | ~$1,100 |
| Sideways Range | 0% to ~$1.52 | ~$1,000 |
| Bearish Dip | -10% to ~$1.36 | ~$900 |
FAQs
What are the predicted price forecasts for the asset?
The daily price forecast for NEAR Protocol is approximately $1.52, with a weekly forecast of around $1.54. The price is expected to range between $1.48 and $1.55 today, and $1.50 to $1.58 over the week.
What are the key support and resistance levels for the asset?
Key support levels for NEAR Protocol are at $1.48, $1.44, and $1.40. Resistance levels are at $1.55, $1.59, and $1.63, with the pivot point at $1.52.
What are the main factors influencing the asset’s price?
Factors influencing NEAR Protocol’s price include increasing adoption in decentralized applications, technological advancements, and market sentiment. Regulatory changes and competition from other blockchain platforms also play a significant role.
What is the outlook for the asset in the next 1 to 6 months?
In the next 1 to 6 months, NEAR Protocol’s price is expected to range between $1.50 and $1.70, depending on market conditions. Continued development and adoption could drive prices higher, while external factors may pose risks.
What are the risks and challenges facing the asset?
Risks facing NEAR Protocol include market volatility, competition from other blockchain platforms, and potential regulatory hurdles. Investors should remain cautious and informed about these challenges as they navigate the market.
Disclaimer
In conclusion, while the analysis provides a structured outlook on the asset’s potential price movements, it is essential to remember that financial markets are inherently unpredictable. Conducting thorough research and staying informed about market trends and economic indicators is crucial for making informed investment decisions.