Prices Forecast: Technical Analysis
For today, we predict a closing price of $103.00 for The Charles Schwab Corporation, with a range between $102.00 and $104.50. Looking ahead to the week, we anticipate a closing price of $104.00, with a potential range of $102.50 to $105.50. The Relative Strength Index (RSI) currently sits at 66.17, indicating a bullish trend but approaching overbought territory, suggesting caution for aggressive buying. The Average True Range (ATR) of 2.36 indicates moderate volatility, which could lead to price fluctuations within our predicted range. The pivot point at $101.98 suggests that the asset is trading above this level, reinforcing a bullish sentiment. Resistance levels at $103.65 and $104.77 may act as barriers to upward movement, while support levels at $100.86 and $99.19 provide downside protection. Overall, the technical indicators suggest a bullish outlook, but traders should remain vigilant for potential pullbacks.
Fundamental Overview and Analysis
The Charles Schwab Corporation has shown a strong upward trend recently, driven by positive investor sentiment and robust financial performance. Factors such as increased trading volumes and a growing client base have contributed to its rising value. Market participants view Schwab favorably, especially with its competitive pricing and innovative technology offerings. However, challenges such as regulatory scrutiny and market volatility could impact future performance. The asset appears fairly valued at its current price, considering its growth potential and market position. Opportunities for expansion into new markets and services could further enhance its value. Nevertheless, investors should be aware of risks, including competition from fintech firms and potential economic downturns that could affect trading activity.
Outlook for The Charles Schwab Corporation
The future outlook for The Charles Schwab Corporation remains positive, with expectations of continued growth driven by market trends favoring online trading and investment services. In the short term (1 to 6 months), we anticipate the stock may experience upward momentum, potentially reaching the $105-$110 range if current trends persist. Long-term (1 to 5 years), the company is well-positioned to capitalize on the growing demand for investment services, with projections suggesting a price target of $120 or higher, assuming stable market conditions. Key factors influencing this outlook include economic recovery, interest rate changes, and technological advancements in trading platforms. External events such as geopolitical tensions or significant market corrections could pose risks to this forecast, necessitating close monitoring of market conditions.
Technical Analysis
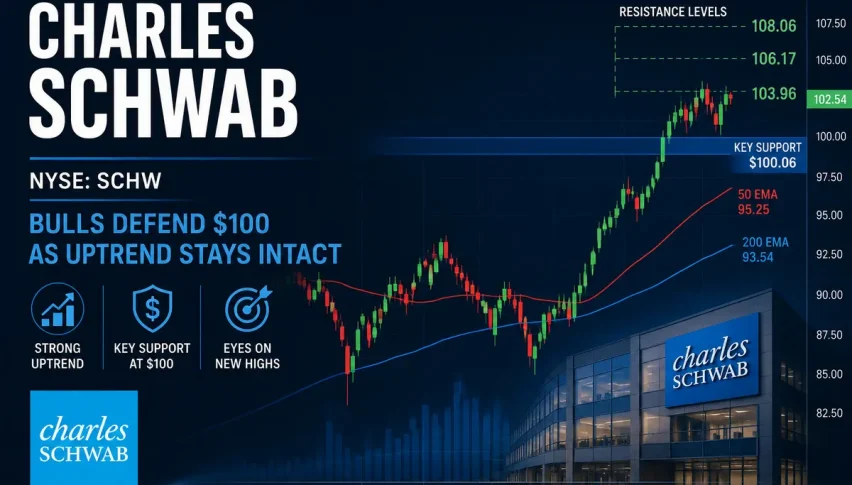
Current Price Overview: The current price of The Charles Schwab Corporation is $102.54, slightly up from the previous close of $102.54, indicating stability in the last 24 hours. The price has shown minor fluctuations, with a notable candle pattern suggesting consolidation around this level. Support and Resistance Levels: Key support levels are at $100.86, $99.19, and $98.07, while resistance levels are at $103.65, $104.77, and $106.44. The asset is currently trading above the pivot point of $101.98, indicating bullish sentiment. Technical Indicators Analysis: The RSI at 66.17 suggests a bullish trend, but caution is warranted as it approaches overbought territory. The ATR of 2.36 indicates moderate volatility, while the ADX at 25.85 shows a strengthening trend. The 50-day SMA is at $94.89, and the 200-day EMA is at $94.22, indicating a bullish crossover. Market Sentiment & Outlook: Overall sentiment is bullish, supported by price action above the pivot point, a rising RSI, and a strengthening ADX, suggesting potential for further gains.
Forecasting Returns: $1,000 Across Market Conditions
The table below outlines potential investment scenarios for The Charles Schwab Corporation, providing insights into expected returns based on different market conditions. Investors should consider these scenarios when deciding whether to invest $1,000 in the asset.
| Scenario | Price Change | Value After 1 Month |
|---|---|---|
| Bullish Breakout | +10% to ~$112.80 | ~$1,100 |
| Sideways Range | 0% to ~$102.54 | ~$1,000 |
| Bearish Dip | -5% to ~$97.41 | ~$950 |
FAQs
What are the predicted price forecasts for the asset?
The predicted daily closing price for The Charles Schwab Corporation is $103.00, with a weekly forecast of $104.00. These predictions are based on current technical indicators and market trends.
What are the key support and resistance levels for the asset?
Key support levels are at $100.86, $99.19, and $98.07, while resistance levels are at $103.65, $104.77, and $106.44. The asset is currently trading above the pivot point of $101.98, indicating bullish sentiment.
What are the main factors influencing the asset’s price?
Factors influencing The Charles Schwab Corporation’s price include market demand for trading services, regulatory changes, and overall economic conditions. Investor sentiment and competitive positioning also play significant roles.
What is the outlook for the asset in the next 1 to 6 months?
The outlook for The Charles Schwab Corporation in the next 1 to 6 months is positive, with expectations of upward momentum potentially reaching the $105-$110 range. This is supported by favorable market trends and strong financial performance.
What are the risks and challenges facing the asset?
Risks facing The Charles Schwab Corporation include regulatory scrutiny, competition from fintech firms, and potential market volatility. These factors could impact trading volumes and overall performance.
Disclaimer
In conclusion, while the analysis provides a structured outlook on the asset’s potential price movements, it is essential to remember that financial markets are inherently unpredictable. Conducting thorough research and staying informed about market trends and economic indicators is crucial for making informed investment decisions.