Be Prepared for a Busy Week in the Markets! Interest Rate Decisions Galore, US Nonfarm Payrolls Numbers, and Much More
Hello, fellow traders! I hope you had a profitable week in the markets. We saw some pretty impressive price movements in certain instruments last week, especially in some of the major stock indices like the U.S. S&P 500 and the German Dax.
The week that lies ahead of us is loaded with important economic data, central bank rate decisions, and monetary policy statements. Here is a brief outline of the most important events this week:
-
BoJ (Bank of Japan) Interest Rate Decision – Tuesday, Time: Tentative
-
BoJ Monetary Policy Statement – Tuesday, Time: Tentative
-
BoJ Outlook Report – Tuesday, Time: Tentative
-
BoJ Press Conference – Tuesday 06:30 GMT
-
Canadian GDP (Gross Domestic Product) Numbers – Tuesday 13:30 GMT
-
UK Manufacturing PMI – Wednesday 09:30 GMT
-
US ISM Manufacturing PMI – Wednesday 15:00 GMT
-
FOMC Statement and FED Interest Rate Decision – Wednesday 19:00 GMT
-
UK Construction PMI – Thursday 09:30 GMT
-
BOE Inflation Report and Interest Rate Decision – Thursday 12:00 GMT
-
US Nonfarm Payrolls Numbers and Unemployment Rate – Friday 13:30 GMT
Let’s jump to the charts immediately…
S&P 500 – Still in Bullish Territory
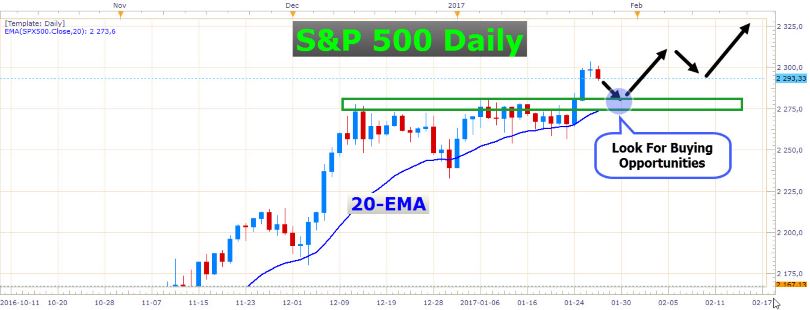 S&P 500 Daily Chart
This American stock index is just rocketing higher. After trading sideways for several weeks, it finally broke out of this consolidation and printed fresh all-time highs.
At the moment it looks like we could get a move back to the mean, which is represented by the 20-day exponential moving average in the chart above. This market is extremely bullish, and a continuation of this upward momentum is highly probable. Make sure you take your slice of the cake by buying into this index. Just remember to use proper price action signals to confirm your entry. When I have a specific support level in mind like the green box in the chart above, I like to see price rejection(s) off of it. For example, a pinbar candle with a lower shadow penetrating the particular zone.
Dax – Reaching Higher and Higher
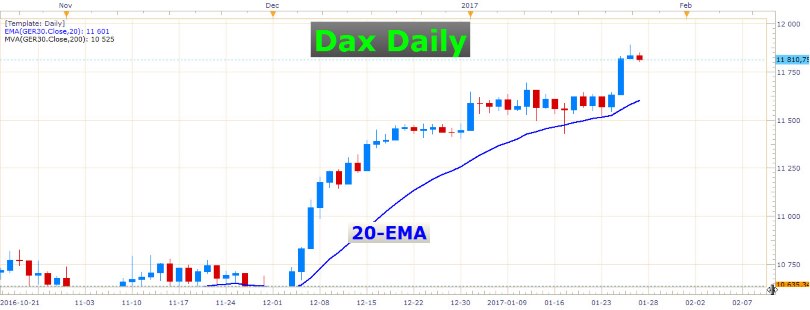
Dax Daily Chart
The German 30, also called the Dax, is also incredibly bullish just like the S&P 500. You can trade this stock index in the same way as the S&P 500. I have a feeling that retracements on the Dax might be shallower than on the S&P 500, so to get into this trend might require you to fine-tune your entries on a lower timeframe like a 4-hour chart, for example.
Gold – Not Looking Too Shiny
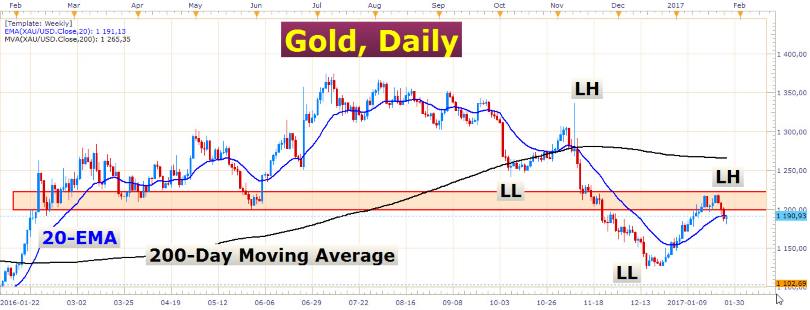
Gold Daily Chart
I’m still very bearish on gold. I just think we could get a retracement into this red box in the chart above, though. This could, of course, present a great opportunity to enter into short positions.
This red box in the chart above was an important former support zone, which has recently turned into an area of resistance. If this resistance holds, which is expected, we should see a decent decline in the near-term.
GBP/USD – The Bulls are Getting Exhausted
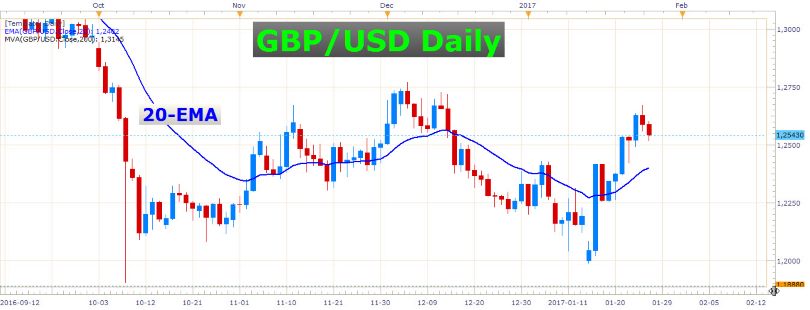
GBP/USD Daily Chart
As I mentioned earlier, there is high-level event risk out of the UK this week in the form of important economic data and an interest rate decision by the BoE (Bank of England). This makes forecasting price movements on the GBP/USD tricky because this data can push the pair in any direction. Nevertheless, let’s look at the technicals and the overshadowing fundamentals for some clues to the next moves in this exchange rate…
In the chart above we can see that this pair is still trading in a large range. The last two daily candles suggest that the price might have some difficulty in overcoming the range top. If we get something remarkable from the BoE this week, this range top could quickly get shattered, though. Just keep in mind that the Brexit cloud is still hanging over the UK, and of course, over the British Pound. What will weigh more – unresolved Brexit fears, or good economic data out of the region? It’s difficult to tell, but perhaps the Pound’s aggressive decline over the last couple of months has been an overreaction to the whole Brexit theme. With this in mind, we could reason that the Pound is perhaps significantly undervalued. Now if this is the case, and the market starts to react to it, the release of positive economic data coupled with simultaneous tightening by the Bank of England, could cause the Pound to rebound aggressively. Let’s add some more fuel to this explosive situation: what if we saw the “hard Brexit” fears abate even further. This would create the perfect environment for a massive move higher in the GBP/USD. Let’s see what the BOE’s Super Thursday will bring this week.
AUD/USD – Trading in a Large Range
There is a lot of indecision in the currency market at the moment. Many major pairs are either consolidating or trading in ranges. The AUD/USD is no exception. Let’s look at a daily chart of this pair:
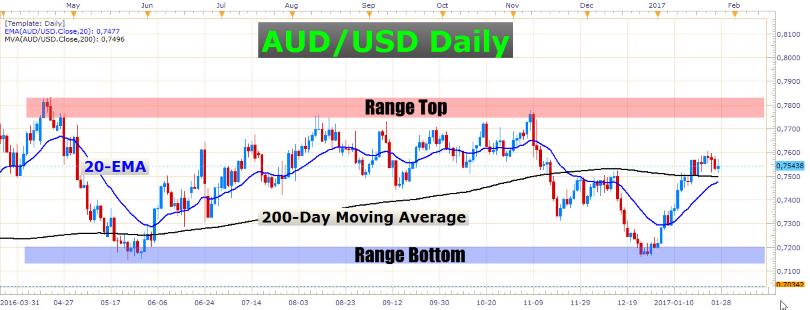
AUD/USD Daily Chart
As you can see, this pair has gone absolutely nowhere in the last eight months. It looks like the recent bullish momentum is starting to wane. If the US Dollar makes a comeback in the next few weeks, this pair might be heading for this range bottom once again. Failure to reach the range top would also advocate a return to the range bottom.
Personally, I’m not interested in trading this pair at the moment. When I trade ranges, I prefer to get into positions closer to the range top or bottom. Trading in the middle of a large range has potential but it can be tricky and risky. Why would we not rather trade an instrument like the S&P 500 which is trending aggressively? We need to trade high probability setups in order to maximize our profitability.
That’s all for today guys. Be careful this week, there is a lot of volatility ahead.
Good luck with your trading!!
- Check out our free forex signals
- Follow the top economic events on FX Leaders economic calendar
- Trade better, discover more Forex Trading Strategies
- Open a FREE Trading Account
- Read our latest reviews on: Avatrade, Exness, HFM and XM

Related Articles



Sidebar rates

Related Posts
 Save
Save