Crude Oil Obeying Technicals – EIA Stockpiles Report In Focus
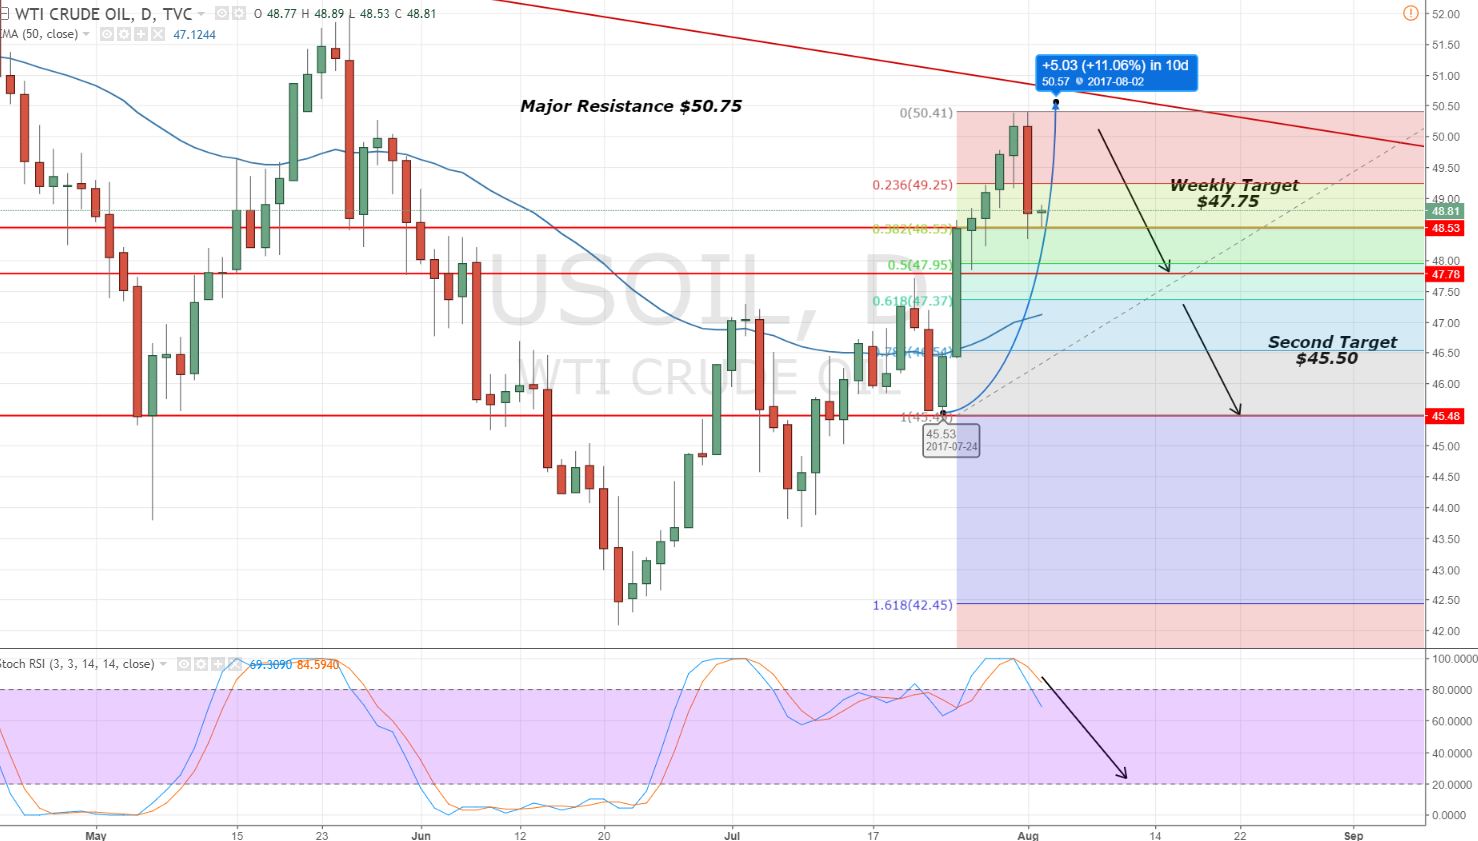
As mentioned in my previous update, this week crude oil was supposed to fall nearly +250 pips to target $47.75 below $50.75. Yesterday, it plunged sharply for more than 200 pips to place a low of $48.34. The market seems to be obeying technicals, so let's look into what we can expect from the crude oil.
 Crude Oil – Daily Chart – 38.2% Retracement
 Crude Oil – Daily Chart – 38.2% Retracement
Despite the fact that on the lower timeframes, the crude oil has entered the oversold region. Yet, buying still doesn't seem to be a good idea.
Quick break down of the key technical points:
– On the daily chart, oil has just completed 38.2% Fibonacci retracement at $48.50, making that the immediate support today.
– We can see the bearish engulfing candle on the daily chart, which signifies that the bears are dominating the oil market.
– 50- periods EMA is near $47, suggesting the oil prices are far away from their average prices & it should fall back to $47 zone.
What Should We Do Now?
Wait! We need to wait for the US session as the EIA (Energy Information Administration) will be publishing the Crude Oil inventories figures for the previous week.
- Inventories Draw up to -3.2M = Bullish Oil
- Inventories Draw up to -7.2M = Sharp Bullish Trend up to $50
However, the build in inventories (positive number) will push the oil deeper toward $47.35 & $46.50.
- Check out our free forex signals
- Follow the top economic events on FX Leaders economic calendar
- Trade better, discover more Forex Trading Strategies
- Open a FREE Trading Account
- Read our latest reviews on: Avatrade, Exness, HFM and XM
Related Articles


Sidebar rates
Related Posts
