NZD/USD Approaching Resistance, Get Ready to Trade
Until now the market has been pretty quiet during the Asian trading session but it started to move a while ago, going against the USD.This
Until now the market has been pretty quiet during the Asian trading session but it started to move a while ago, going against the USD.
This move is providing us with some trade setups, one of which just appeared on NZD/USD. There´s no real reason behind this move, probably just some stop loss triggering before the market sets itself for the US session.
Looking at the H4 NZD/USD chart, we can see that the 0.75 level where we are right now has been providing resistance previously and if you scroll back through the chart history, you can also see that it provided support before.
 The resistance is pretty clear
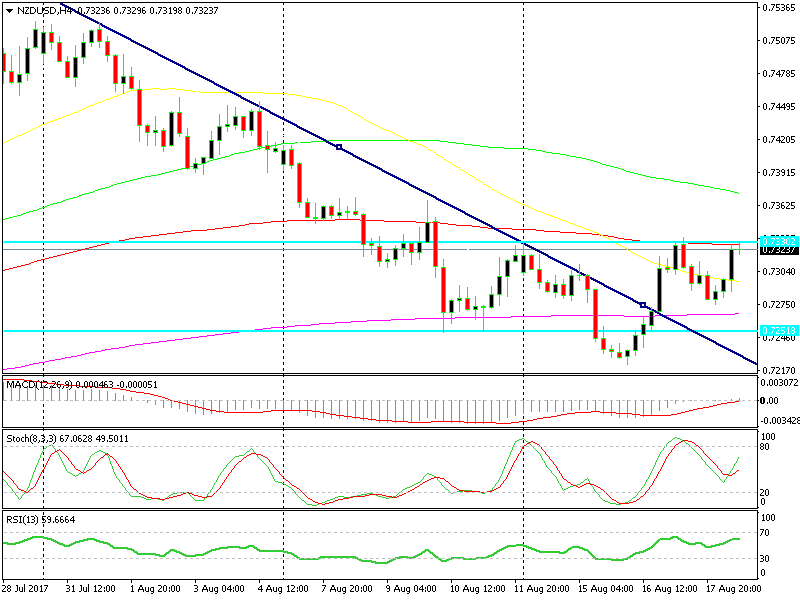
The 100 SAM (red) has acted as support and resistance level quite well. It's holding at the same level as the resistance, adding additional strength to this level.
The 200 SMA (purple) is another indicator which stands in the way for the buyers. It's about 5 pips higher than the 100 SMA on the H4 chart. That's three technical indicators providing resistance.
The H1 chart is severely overbought and the H4 chart is becoming overbought since stochastic is almost there, so we´re going in. We just opened a sell signal in this forex pair. Let´s see how this trade unfolds.
- Check out our free forex signals
- Follow the top economic events on FX Leaders economic calendar
- Trade better, discover more Forex Trading Strategies
- Open a FREE Trading Account
- Read our latest reviews on: Avatrade, Exness, HFM and XM
Related Articles


Sidebar rates
Related Posts
