GBP/USD Inches Closer to the Big Level
Yesterday we posted a forex update about GBP/USD. We highlighted the 1.40 level as a possible resistance level where we might see ...
Yesterday we posted a forex update about GBP/USD. We highlighted the 1.40 level as a possible resistance level where we might see this forex pair make a big turnaround.
It is a big round number, but more than that, it is a level which has defined the normal trading range for this pair. As you can see from the monthly chart below, this pair has traded for about 20 years above 1.40, roughly to speak. Those were normal years. After the Brexit referendum, we entered an abnormal period.
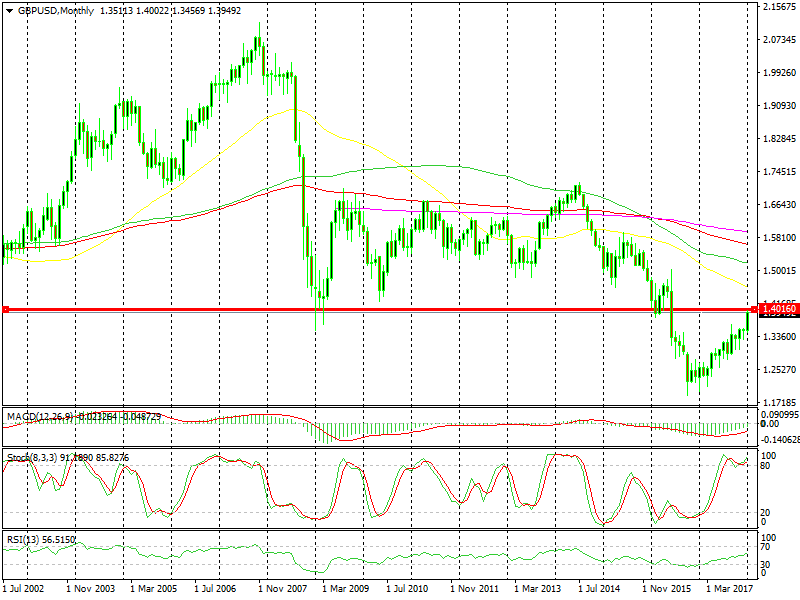
This pair has traded above 1.40 for a long time
I say “roughly to speak” because there have been spikes below and turnarounds above but this is the area, more or less. To have a better idea, have a look at the weekly chart below. The 100 smooth moving average (red) comes at around 1.4050.
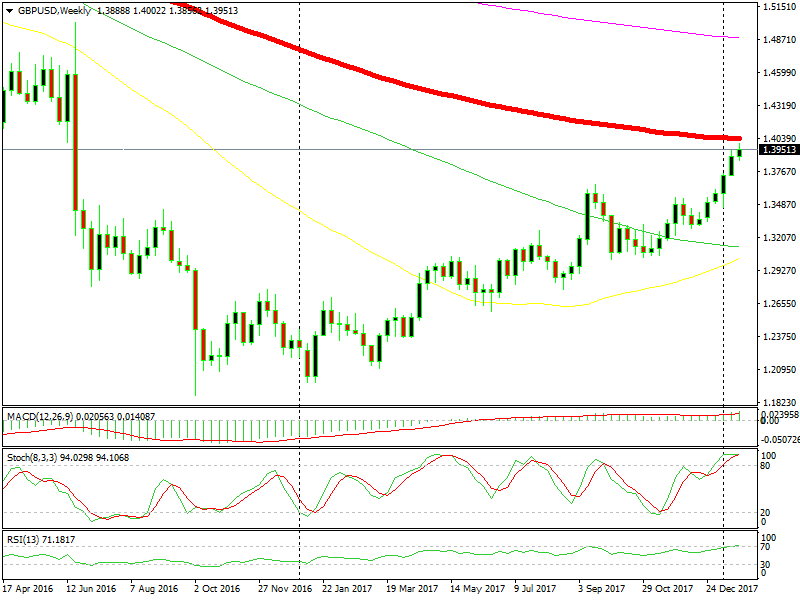
The 100 SMA is standing above
So, the resistance area stretches until up there at least. I would say until 1.41, because these big levels have a big buffer zone around them. We have slipped lower today. So, the big level and the 100 weekly moving average are still above. Will this be the place where GBP/USD turns back down? After all, it has climbed more than 20 cents in about a year.
It is definitely worth the money giving the short side a try up here. But, we already opened a long term sell signal above 1.36. So, if you do, make sure to put stop loss above 1.41. The first target would be 1.3650.
- Check out our free forex signals
- Follow the top economic events on FX Leaders economic calendar
- Trade better, discover more Forex Trading Strategies
- Open a FREE Trading Account
- Read our latest reviews on: Avatrade, Exness, HFM and XM
Related Articles


Sidebar rates
Related Posts
