Bitcoin Completes the Retrace Down on the Daily Chart. Time to Go Long?
Bitcoin made a bullish reversal last month. It climbed more than $2,500 but we missed the chance. Now, another opportunity to buy appears.
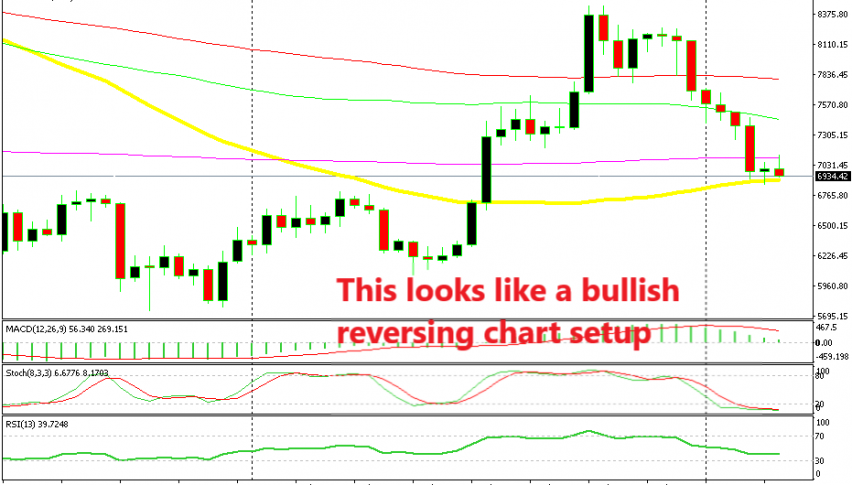
Daily Chart
Bitcoin made a bullish reversal last month. It flushed off some weak stops below the $6,000 level at the end of June, and in July Bitcoin completed the first bullish move which took this cryptocurrency around $2,500 higher.
We missed that move because the major trend has been bearish for Bitcoin this year, so we thought that this might be another weak pullback higher before Bitcoin resumed the downtrend. But, Bitcoin broke all the moving averages on the daily timeframe and made new highs which meant the trend had changed.
We couldn’t get in late on that move, so I highlighted in the previous weeks that I will try to get in long on Bitcoin when we see a pullback lower. Now the pullback lower seems complete on the daily chart.
The moving average I was eyeing was the 50 SMA (yellow). The price has reached that moving average and it is finding support right above it now. If you look at the stochastic indicator, you can see that it is severely oversold, which means that the retrace lower is complete and the price is oversold on the daily chart.
But, we must get a confirmation for that. The confirmation comes from yesterday’s daily candlestick. It formed a doji above the 50 SMA which is a reversing signal after a pullback.
Weekly Chart
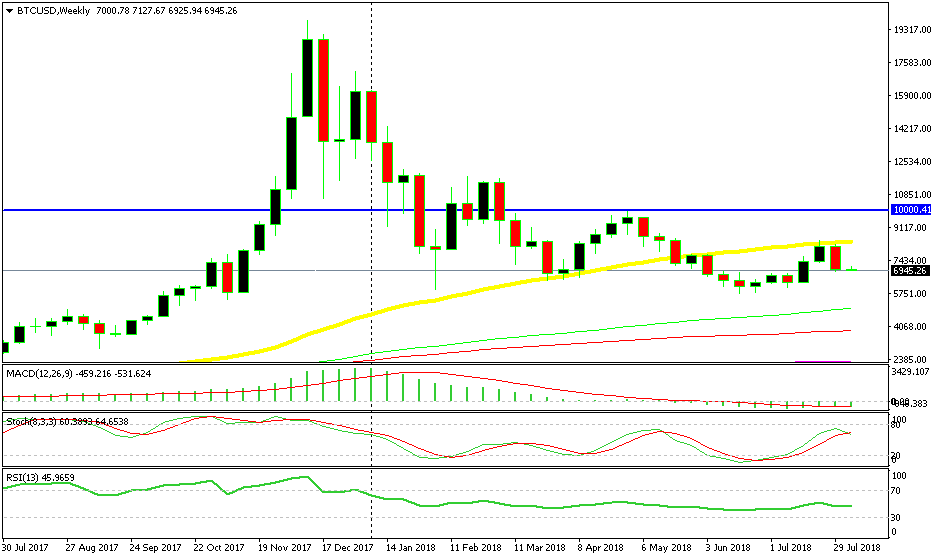
The weekly chart looks pretty bearish though
Although, the daily chart looks a bit scary for buyers. The 50 SMA refused the price last week, the weekly candlestick looks really bearish. In fact, the chart setup looks pretty bearish since the last two candlesticks have formed a bearish engulfing pattern. Besides that, the stochastic indicator is heading down.
In this chart, the place to buy Bitcoin would be at the previous lows around $6,000. Stochastic would be oversold by then and the 100 SMA (green) would have caught up with the price, thus providing support. But, the daily chart is pointing to a bullish reversal now, so they are contradicting each other. Well, we have to take a decision. If we are buying here based on the daily chart, then we have to place the stop loss target below the previous lows just to be sure. I might do just that now, so watch the signals page for a Bitcoin signal soon.
- Check out our free forex signals
- Follow the top economic events on FX Leaders economic calendar
- Trade better, discover more Forex Trading Strategies
- Open a FREE Trading Account
- Read our latest reviews on: Avatrade, Exness, HFM and XM
Related Articles


Sidebar rates
Related Posts
