US Oil, Above or Below the 200 SMA?
US Oil broke above $75 for a moment in July but it formed a morning star candlestick and it made a quick bearish reversal. Now it faces...
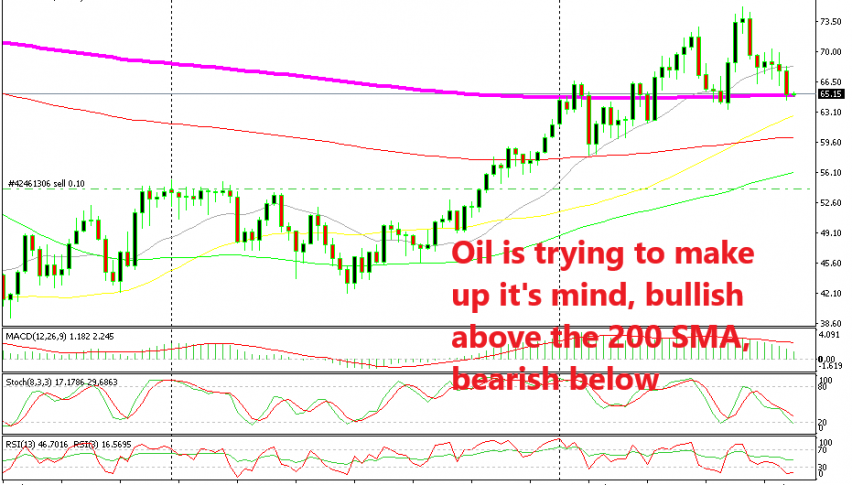
Oil prices have been going up since they bottomed out early in 2017 at $26/barrel. Although, the trend in the past year or so has been pretty straightforward. The 20 SMA (grey) has been pushing oil higher as it has provided support a few times in Spring.
US Oil broke above $75 for a moment in July but it formed a morning star candlestick and it made a quick bearish reversal. The 20 SMA held for several weeks but eventually was broken and US Oil lost around $10 from top to bottom.
But, it has reached the 200 SMA (purple) now which is providing support. This moving average looks like a decent support indicator so it is possible that oil might turn bullish here if the sellers fail to break the 200 SMA in the coming days/weeks.
The stochastic indicator is also oversold now. So, according to this chart setup, we might see a bullish reversal and a continuation of the uptrend. But, we might also well witness a continuation of the bearish move.
The world economy is doing alight now, apart from Japan of course, which should support higher oil prices, but the trade war might ruin things for everyone. That would surely send Oil prices tumbling lower. The situation in Turkey is another risky event for Oil. If things escalate, it might be contagious for other emerging market economies which would be disastrous for Oil. Well, we will see how Oil reacts around the 200 SMA now. If it breaks below, then the bearish scenario comes into play.
- Check out our free forex signals
- Follow the top economic events on FX Leaders economic calendar
- Trade better, discover more Forex Trading Strategies
- Open a FREE Trading Account
- Read our latest reviews on: Avatrade, Exness, HFM and XM
Related Articles
Sidebar rates
Related Posts
