EUR/USD Forms a Bearish Setup on the Daily Chart
EUR/USD climbed 200 pips higher on US elections, but it seems liek the retrace is over now and a bearish chart setup is forming.
Forex traders closed a few trades last week as they adjusted their positions ahead of the US midterm elections. As a result, the US Dollar lost around 150 pips last week. Then we saw another wave of USD selling yesterday after it became apparent that the Democrats had won the US Congress.
The USD had been on an uptrend in the previous several weeks, so this selloff for the elections was a good opportunity for a refreshing of the charts and a decent retrace. Many major pairs retraced and so did EUR/USD, but that retrace seems complete now.
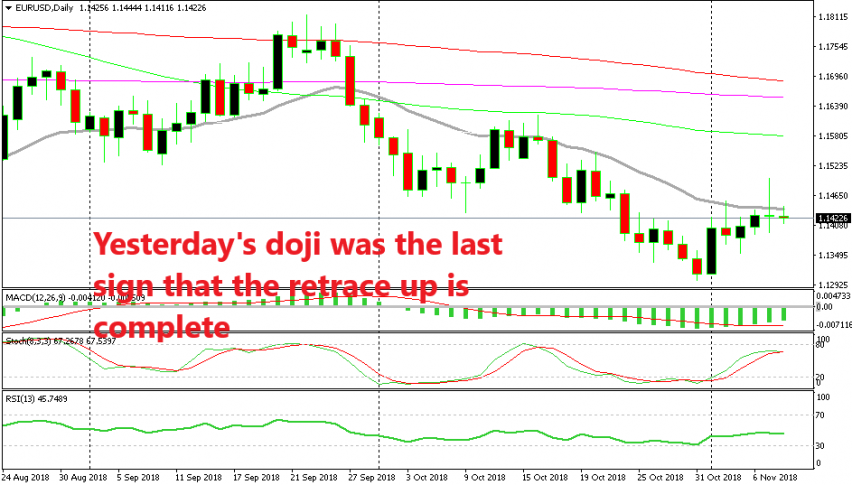
As you can see from the daily EUR/USD chart above, the stochastic indicator is almost overbought and it is now turning down. Besides that, the price has been finding resistance at the 20 SMA (grey) during the last several days. This pair pierced the 20 SMA yesterday as it spiked higher after the elections, but it turned back down, so it remains as a resistance indicator.
In fact, yesterday’s candlestick closed as a doji which is a reversing signal, especially after a retrace during a downtrend. Now, stochastic is nearly overbought and turning down and the 20 SMA is providing resistance, so it seems like EUR/USD is about to resume the downtrend again.
If you are trading this chart setup and trying to sell this pair, make sure to place the stop above 1.15 which was the top yesterday. The first target should be somewhere above 1.13 since that level has formed a solid support for EUR/USD.
- Check out our free forex signals
- Follow the top economic events on FX Leaders economic calendar
- Trade better, discover more Forex Trading Strategies
- Open a FREE Trading Account
- Read our latest reviews on: Avatrade, Exness, HFM and XM
Related Articles


Sidebar rates
Related Posts
