UK Brent Crude Oil Facing 2 Moving Averages as it Continues North
UK Brent Crude Oil has reached 2 MAs on the daily chart and has formed a reversing setup which is very attractive for sellers
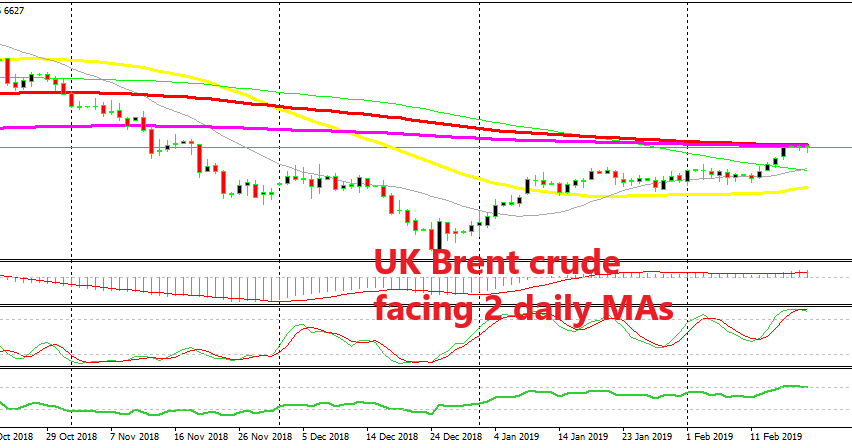
As we have mentioned quite a few times lately, risk assets such as Crude Oil and stock markets reversed the first trading day after Christmas amid terribly thin liquidity. UK Brent and US WTI crude broke above the 100 simple MA on the daily chart last week, but while the US WTI crude is around 300 pips below the other two moving averages, UK Brent has already reached them and is finding resistance there.
UK Brent reached these moving averages last Friday and it has been unable to move above them since then. We can see that the price has formed a couple of dojis just below the 100 SMA (red) and the 200 SMA (purple). These sort of candlesticks are reversing signals and Oil is already overbought on this time-frame as the stochastic indicator shows.
This suggests a possible reversal or a retrace at least. In such a scenario, the first target would be the 100 simple MA (green) which stands around 350 pips lower at $62.80. The next target which is also in sight is the 50 SMA (yellow) standing at $60. This level would make sense for a pullback scenario, where the buyers would regroup and give the upside another go.
The stop loss would be above the two moving averages which would mean a 50-70 pip target. The risk/reward ratio for this trade is quite attractive but the buyers still remain in control. We might decide to take this trade and go short on UK crude Oil, but I can’t promise since it is a risky trade. So, it’s up to you if you want to give this counter trend trade a go.
- Check out our free forex signals
- Follow the top economic events on FX Leaders economic calendar
- Trade better, discover more Forex Trading Strategies
- Open a FREE Trading Account
- Read our latest reviews on: Avatrade, Exness, HFM and XM
Related Articles


Sidebar rates
Related Posts
