NZD/USD Heads for the 200 SMA After Bouncing Off the 100 Daily SMA
NZD/USD has been climbing higher for about a week, but it is too close to the 200 SMA where it has found solid resistance before
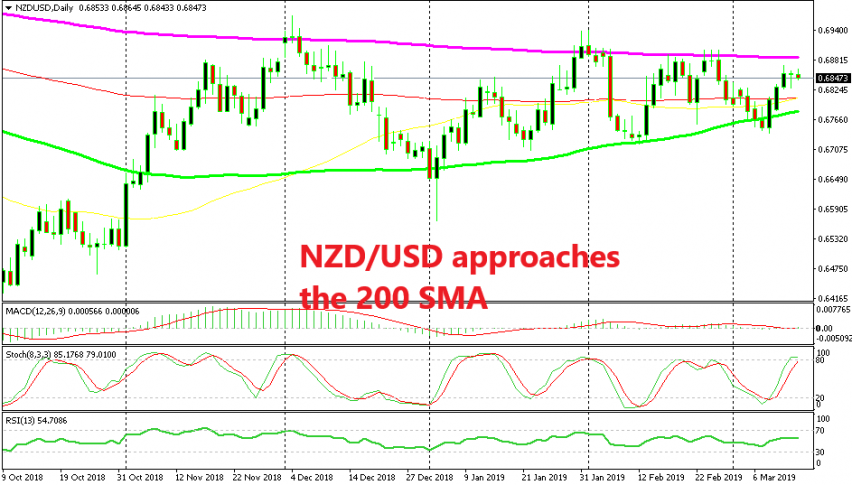
[[NZD/USD]] turned bullish last week after the soft US non-farm employment change figures. The price had been trending down for more than a week prior to that, but the data release came at the time the price was trading around the 100 SMA (green) on the daily chart.
This moving average has been providing support on the daily time-frame in the previous weeks a couple of times and the pair has reversed higher two more times close at the 100 SMA. So, the zone surrounding this moving average should be considered as a solid support area.
The bounce also came when the stochastic indicator was oversold. Now, the price seems to be heading towards the 200 SMA (purple) at the top. This moving average has been the opposite of the 100 SMA. It has provided resistance four times from what I can see since early December, and chances are that it will turn into resistance again this time.
That would be a good place to consider going short from. It has been pierced before, but it hasn’t been broken and a bearish reversal has followed each time. The USD has also been on a bearish trend for about a week which seems unjustified fundamentally, so it is time for the USD to make a comeback.
Therefore, I will try to open a long term sell signal up there if the price action points to a reversal lower, but let’s follow it for some time.
- Check out our free forex signals
- Follow the top economic events on FX Leaders economic calendar
- Trade better, discover more Forex Trading Strategies
- Open a FREE Trading Account
- Read our latest reviews on: Avatrade, Exness, HFM and XM
Related Articles


Sidebar rates
Related Posts
Ava

