Gold Bouncing off the 200 SMA and After Completing the Elliot Wave Pattern
Gold has been trending down for two weeks completing the Elliott Wave Pattern, which is now over and Gold is bouncing
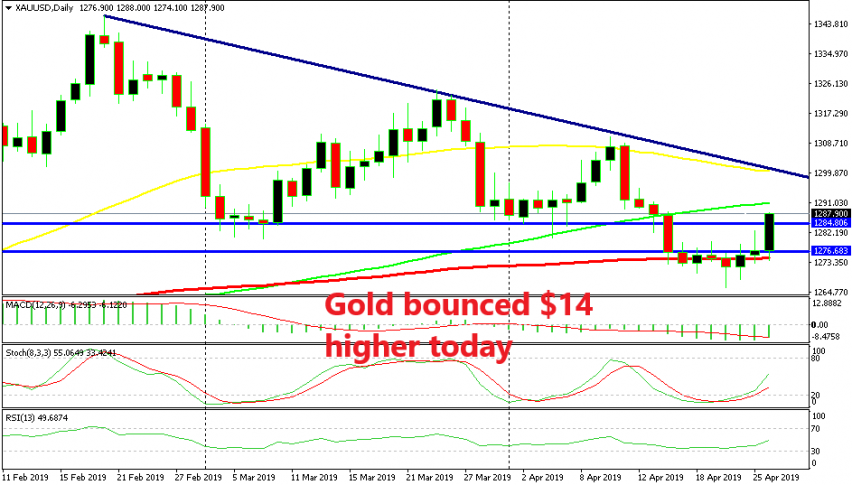
GOLD turned bearish in February after forming an upside-down hammer candlestick on the daily time-frame chart. That hammer was a strong reversing signal after Gold trended higher since summer last year. Since that hammer, the pressure has been to the downside, so the trend has reversed.
Since the reversal began, Gold completed three waves down and two smaller retracing waves higher. This looks exactly like an Elliott Wave Pattern which consists of five waves like this. But, according to this chart pattern, the downtrend is over now since this pattern is complete. Gold formed several doji and pin candlesticks which are reversing signals.
That happened at the 100 SMA (red) which seems like it turned into support now since it did provide it. Only today, Gold is around $14 higher so the bounce is pretty strong. Now the question that follows is where is this bullish move going to end, because the support level above $1,280 didn’t turn into resistance?
Will it be the 100 smooth MA (green) which provided support on the way down early this month? Or will it be the 50 SMA (yellow) which also coincides with the descending trend line. However the case, we will follow the price action and see if we get some signals at either place. I think that this will be a good opportunity to open a long term sell signal in Gold.
- Check out our free forex signals
- Follow the top economic events on FX Leaders economic calendar
- Trade better, discover more Forex Trading Strategies
- Open a FREE Trading Account
- Read our latest reviews on: Avatrade, Exness, HFM and XM
Related Articles


Sidebar rates
Related Posts
