Weekly Crypto Roundup
The market continues its uptrend and Bitcoin even surpassed prior resistances this week.
The market continues its uptrend and Bitcoin even surpassed prior resistances this week. To find out how high the market can reach until a major correction is likely to take place, we’ll take a look at the technical analysis of Bitcoin, Ethereum and Ripple.
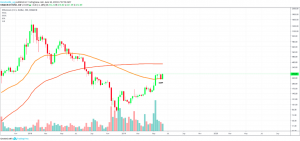
BTC/USD DAILY CHART
Bitcoin surpassed the previous resistance at $8400 and gained 25 percent this week. With Bitcoin reaching as high as $9450, it is only $70 away from the major resistance at the 0.382 fib extension level at $9520. The RSI is touching overbought regions and the MACD recently crossed bullishly while the histogram is ticking significantly higher. Thus, we can expect Bitcoin to continue its uptrend at least to the $10,000 mark, where a retracement seems very likely to follow. Once broken, Bitcoin could increase further to the minor resistance at $11,700 range. If bearishly rejected by the $10,000 mark, Bitcoin could retrace down to the $8400 support, where the 0.382 fib level would act as additional support.
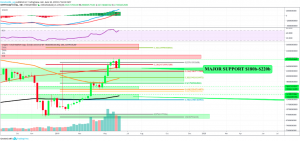
BTC/USD WEEKLY CHART
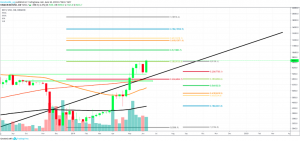
The weekly Bitcoin chart is extremely bullish as a bullish engulfing candle was formed this week. Also, when looking at other charts such as this one, the 0.382 fib level was already surpassed, which implies a continuation of the price hike. The 3-year-trendline acts as additional support at $7400-$8000 this month.
ETH/USD DAILY CHART
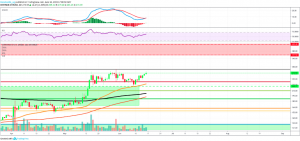
Ethereum bounced perfectly off the 50-day-EMA this week and continued its uptrend towards the major resistance between $360-$420. While the RSI is losing strength which is rather bearish, the MACD recently crossed bullishly and the histogram is ticking higher again. Both are very bullish and with Ethereum finding strong support area between $170-$220, it seems to be a good buy right now.
ETH/USD WEEKLY CHART
Ethereum also formed a bullish engulfing candle which indicates further upward movement. The 100-week-EMA at $370 acts as major resistance, where it is likely to start correcting towards the downside.
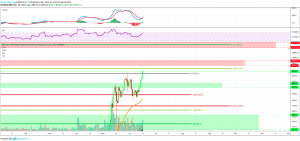
TOTAL CRYPTO MARKET CAP/ USD
The total crypto market capitalization bounced off the support zone at $222b and surged all the way up to the $280b resistance. Due to the bullish engulfing candlestick pattern, it seems likely that the market continues its uptrend and surpasses the resistance at the $300b mark.
XRP/USD DAILY CHART
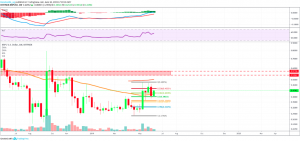
The 0.5 fib level successfully held at support at $0.38 and XRP continued its uptrend towards the $0.55 resistance range. If Bitcoin continues its uptrend, it seems very likely that XRP will surge higher and eventually reach as high as $0.55, where a correction seems very likely to follow.
The biggest gainers of the week were
ITC, which gained by 110 percent,
BOLT, which surged by 120 percent and
NEX, which rose by 69 percent.
LEO, the exchange token of Bitfinex, and NEX, the exchange token of the newly established NASH exchange are very interesting tokens to watch right now, as exchange tokens such as BNB, KCS, BIX and HUOBI token all have a positive ROI and Bitfinex is among the biggest exchanges in the crypto industry. Thus, an increase of the LEO token price seems very likely at this point.
LEO started trading at $1.00 and reached as high as $1.98 this week. $1.74 could be an interesting entry target where the 0.382 fib level is located at.
- Check out our free forex signals
- Follow the top economic events on FX Leaders economic calendar
- Trade better, discover more Forex Trading Strategies
- Open a FREE Trading Account
- Read our latest reviews on: Avatrade, Exness, HFM and XM
Related Articles


Sidebar rates
Related Posts
