The 50 SMA Should Turn Into Resistance for USD/CAD Now
USD/CAD has been on a strong downtrend this week, but it has completed a retrace higher now, so we decided to go short
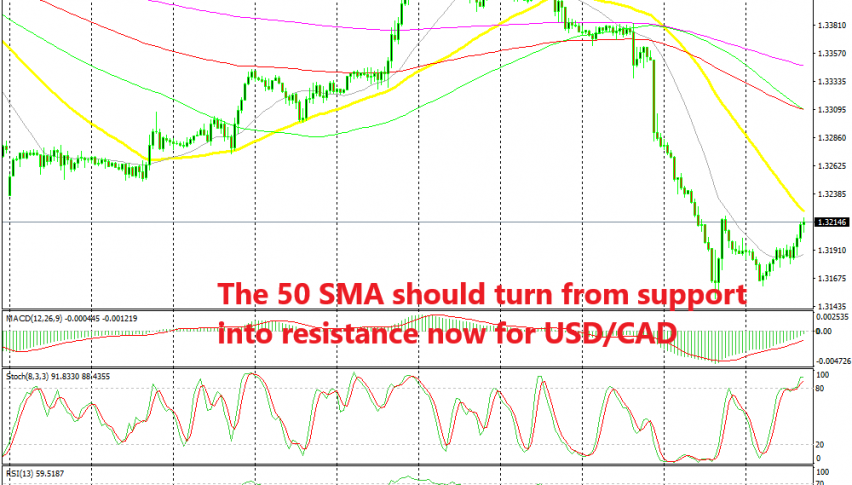
[[USD/CAD]] has turned pretty bearish this week, losing nearly 300 pips from top to bottom after it failed to break the 50 SMA (yellow) on the daily chart which turned from support into resistance at the beginning of this week. The increasing tensions between Iran and the US have helped increase the demand for crude Oil, which is outweighing the negative impact from the slowing global economy.
On the H1 time-frame, the 50 SMA has also provided support for WTI crude Oil as you can see from the chart above, which lasted until Tuesday. It eventually got broken as Iran shot down a US drone which panicked the Oil markets and this pair tumbled lower as a result.
Although, the price has been retracing higher during the European session today after Donald Trump said to have retreated from ordering an attack. This might be a sign that the war Between Iran and the US might not happen which would be great. But now, WTI crude has ran into the 50 SMA on the H1 chart again and it is likely that it turns into resistance. Stochastic is also overbought, which means that the pullback is complete on this time-frame. For this reason, we decided to go short on crude Oil below the 50 SMA.
- Check out our free forex signals
- Follow the top economic events on FX Leaders economic calendar
- Trade better, discover more Forex Trading Strategies
- Open a FREE Trading Account
- Read our latest reviews on: Avatrade, Exness, HFM and XM
Related Articles
Sidebar rates
Related Posts
