The 100 SMA is not Letting Go in AUD/USD
AUD/USD retraced higher in the Asian session after the strong employment numbers from Australia but the 100 SMA stopped the climb again
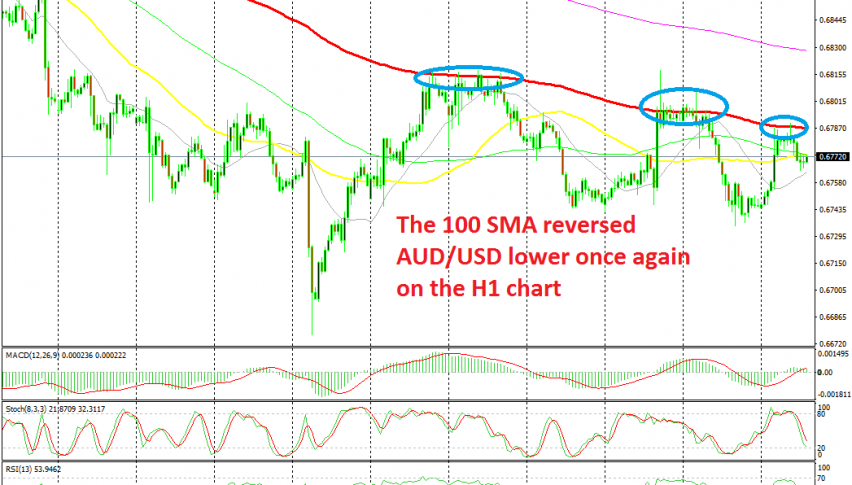
[[AUD/USD]] turned bearish at the middle of July after having completed a decent retrace higher in the previous month as the USD pulled back on accumulating weak economic data. The bearish trend was pretty strong in July and the smaller period moving averages such as the 50 SMA (yellow) or even the 20 SMA (grey) were providing resistance during that time, pushing the price lower.
Although, the bearish trend slowed down this month and last week we saw a decent pullback higher. But buyers couldn’t push above the 100 SMA (red) on the H1 chart which reversed the price lower last week. They had another attempt to break the 100 SMA earlier this week and even pierced this moving average a couple of times, but couldn’t keep the price up there, so that didn’t count as a break.
The price returned back down from there but the employment report from Australia came out pretty strong this morning in the Asian session, showing a 41.1k increase in employment numbers which improved the sentiment for the Aussie. But, buyers failed at the same moving average once again. The price formed a couple of dojis below the 100 SMA and we decided to pull the trigger on that chart setup. The retrace higher was complete and the price reversed back down after that.
- Check out our free forex signals
- Follow the top economic events on FX Leaders economic calendar
- Trade better, discover more Forex Trading Strategies
- Open a FREE Trading Account
- Read our latest reviews on: Avatrade, Exness, HFM and XM
Related Articles


Sidebar rates
Related Posts
