Everything About WTI Crude Oil – Trends, Impact of Trade War & Current Scenario
The trade war between the U.S. and China as spread a great deal of uncertainty among traders, and it's impacting many industries. Market...

The trade war between the US and China has spread a great deal of uncertainty among traders, and it’s impacting many industries. Market volatility is being provoked by President Trump’s ornament of fluctuations between perils and cease-fires on the issue.
At the start of August, the markets plunged over President Trump’s threat to inflict tariffs on a further $300 billion of Chinese imports. The markets were widely influenced; however, the energy sector was hit exceptionally hard. Crude oil prices experienced their most significant decline in the past four years.
President Trump finally backed off, over rising concerns regarding retail spending directed into the holiday period. Besides, the yield on the 10-year US Treasury bonds lately dropped below the yield on the 2-year US Treasury bonds. This yield curve reversal occurs when traders are crowding to safety, and it’s typically a reliable recession indicator.
What could cause a recession?
Most economists believe the market is still moderately healthy, but trade conflicts lose consumers’ money. When users have scarcer money to pay, they buy fewer products. With this, the global economies slow down. That being said, it can lead the United States and the whole world into recession.
What happens when global economies face recession?
Well, with the recession, the demand for products drops, and ultimately, companies stop manufacturing goods due to lack of sales and demand — consequently, the demand and consumption of crude oil fall.
Why US & China play a significant role in crude oil valuation?
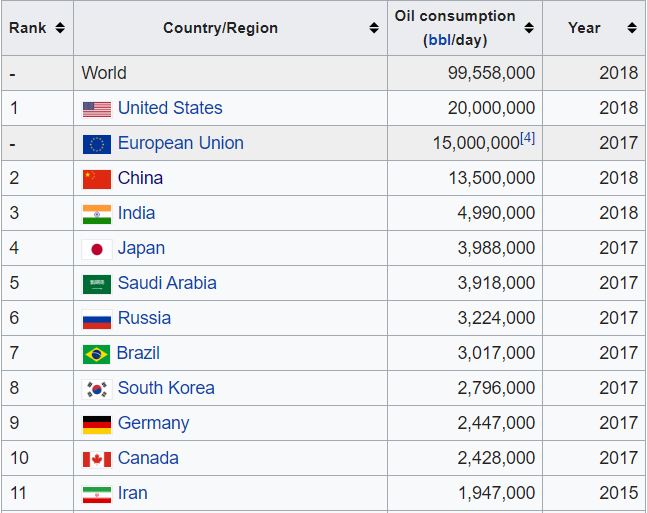
Crude oil prices are highly influenced by the change in the US and China fundamentals, as these are top consumers of crude oil in the world.
According to the International Energy Agency (IEA), the United States secures the first position in top consumers list by consuming around 20,000,000 barrels per day in 2018. While China is at the third number after the European Union with 13,500,000 barrels/day. Consequently, the trade war threatens manufacturing activity and crude oil demand from China and the US. Therefore, the prices of crude oil suffers a lot on any negative fundamentals coming out from the United States and China.
Quick Summary of US-China Trade War
The trade war started back on January 22, 2018, when President Trump announced tariffs on solar panels and washing machines. Approximately 8% of American solar panel imports in 2017 came from China. Imports of household washing machines from China equaled around $1.1 billion in 2015.
Later, Trump inflicted steel and aluminum tariffs on imports from all nations. The US imports of steel from China was around 3%. Things got worse when Trump ordered the United States Trade Representative (USTR) office to review inflicting US$50–60 billion of tariffs on Chinese goods back in March 2018.
That’s when China decided to retaliate for the first time on April 2, 2018. The Ministry of Commerce of China countered by forcing tariffs on 128 products it purchases from America.
Then in the very next month, on May 29, 2018, the White House decided to force 25% tariffs on $50 billion of Chinese goods.
Later in July 2018, the US published a first list of the further $200 billion of Chinese products that would be marked to 10% tariffs. After two days, China pledged to counter with further tariffs on US goods worth $60 billion yearly.
[[WTI]] Crude Oil – Monthly Chart
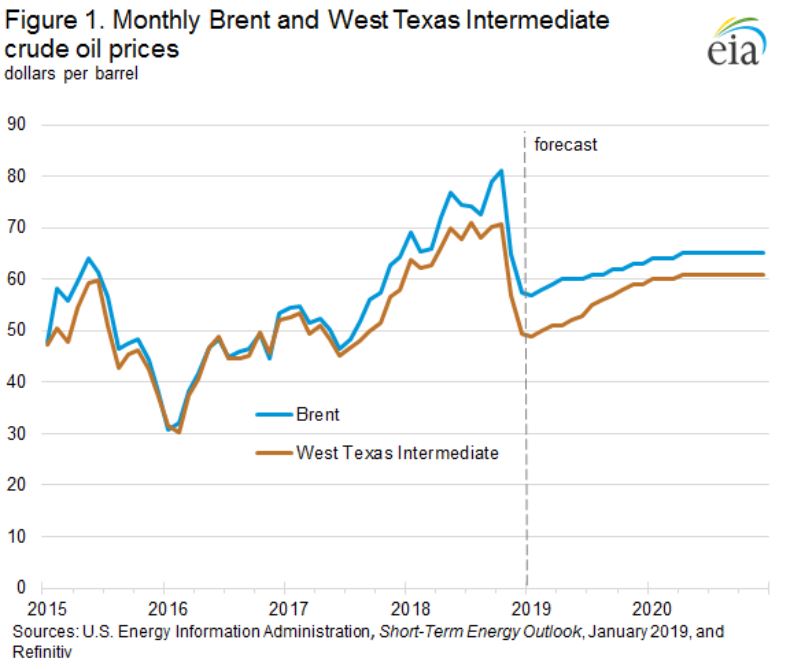
The tit for tat tariffs begun to impact demand and prices of crude oil. As you can see in Crude Oil’s monthly chart, WTI prices fell from $76 per barrel in October 2018 to $42.40 per barrel in December 2018.
Let us study at the recent EIA Inventory report for assessing how the fundamentals are catching up right now.
Crude Oil Inventories – EIA Report
As per the EIA report, crude oil inventories hold around 449.0 million barrels compared to 441 million barrels in storage a year ago.
As we can see in the EIA inventories graph, crude oil inventories have surged so far when compared to previous years, and it’s even forecast to surge to 500 million barrels in the year 2020.
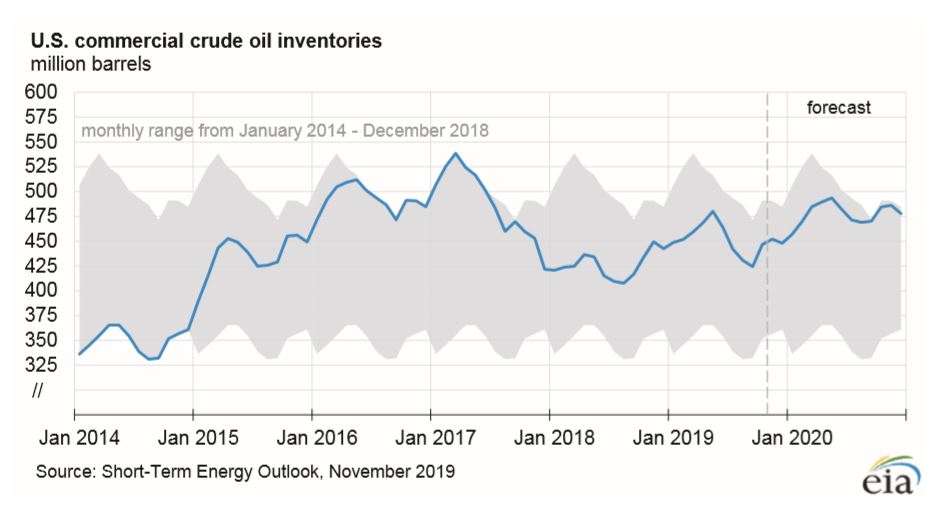
The surge in inventories shows a drop in crude oil demand from global economies, which indeed represents the impact of the ongoing US-China trade war. Consequently, crude oil prices can drop further in the coming year due to a drop in consumption, increase in production, and massive build in inventories.
WTI Crude Oil – Forecast
On the monthly timeframe, crude oil has formed a symmetric triangle pattern, which is extending resistance at $60.75 and support at $51. Here a bullish breakout of $60 can extend buying until $66 while a bearish breakout of 51.55 can trigger further sell-off until $42.25.
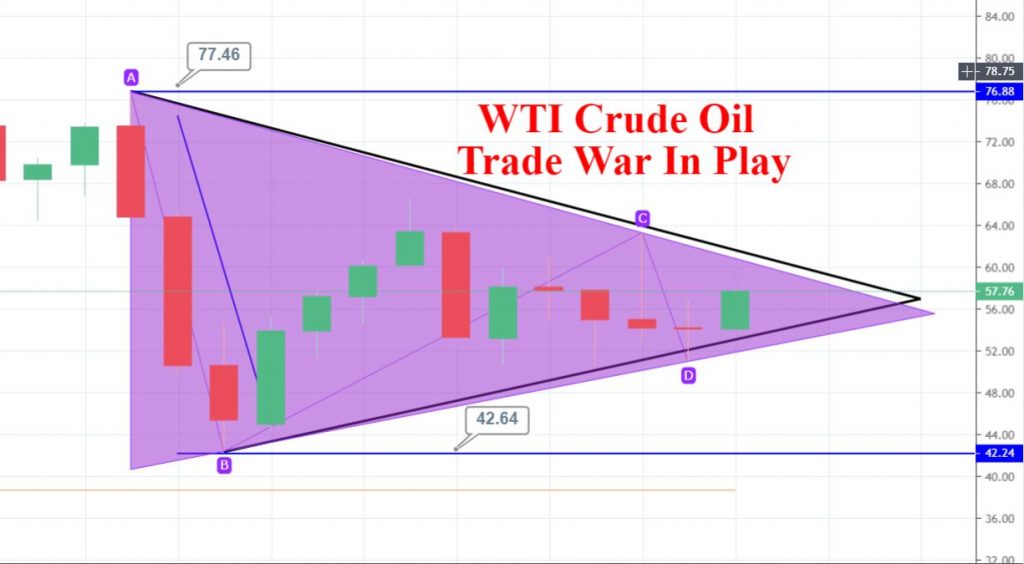
Fellas, the bearish breakout is very likely if both nations fail to reach a deal in the coming months. A day before, the US and Chinese trade teams held “constructive discussions” in a phone call where each side’s core interests of phase one of the trade deal were discussed. We need to keep a close eye on US-China trade deal updates to determine further trends in oil prices.
Good luck and have a great weekend!
- Check out our free forex signals
- Follow the top economic events on FX Leaders economic calendar
- Trade better, discover more Forex Trading Strategies
- Open a FREE Trading Account
- Read our latest reviews on: Avatrade, Exness, HFM and XM
Related Articles
Sidebar rates
Related Posts
