Daily Brief, May 6: Everything You Need to Know About Gold
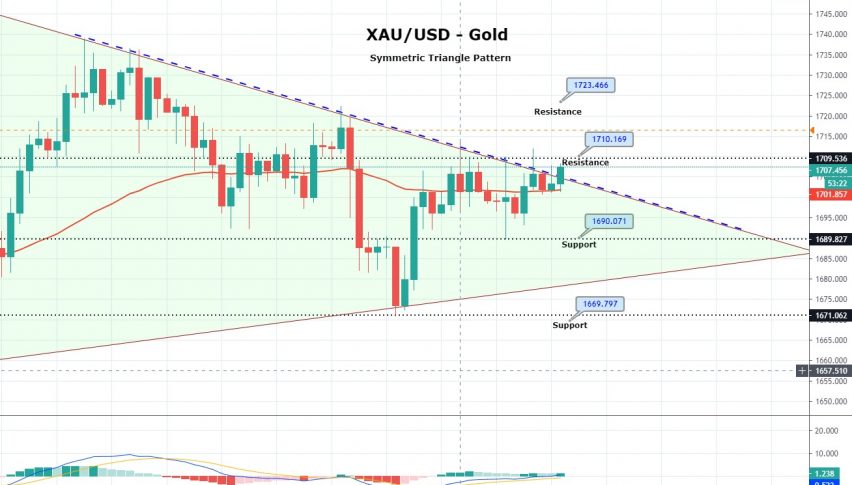
On the technical front, gold has crossed below 50 periods EMA which is providing resistance around 1,711 level. Recent close of bearish engu
Good morning, fellas.
Gold prices closed at 1705.27 after placing a high of 1712.20 and a low of 1689.92. Overall the movement of GOLD remained bullish throughout the day. Gold prices fell after the recovery of crude oil, which increased the demand for risky assets and decreased the demand for safe havens. The improvement of oil prices was caused by the increased number of the US States which were reopening their economies.
The restarting of the economy increased the demand for oil, which collapsed in April after the mandatory lockdowns. Gold prices continue to move in a sideways trading range of 1,710 – 1,690, while the recently formed symmetric triangle pattern is stretching the trading range. The fresh trading range is likely to provide selling below 1,700 and buying above 1,680.
The yellow metal prices are exhibiting mixed bias in the wake of mixed risk sentiment as many nations have also joined the United States in this blamegame to China because of the increased number of deaths and the global economic slowdown, both caused by the coronavirus pandemic.
Britain has stated that China would have to provide clarification about the information it shared regarding the the outbreak. The US is formulating measures to hold China responsible for the damage caused by the pandemic. The measures would probably be sanctions, new trade policies, and cancellation of US debt obligations.
On the other hand, on Sunday, the US Secretary of State, Mike Pompeo, said that there was enormous evidence that the COVID-19 pandemic had originated in a Chinese laboratory in Wuhan. All of the above news indicates the need for safe-haven and hence, gold surged above $1713 on Monday. Coronavirus has infected almost 3.5M people across the globe, and governments & central banks all over the world have announced considerable monetary and fiscal measures to reduce the economic damage.
On the macroeconomic data side, at 19:00 GMT, the Factory orders of the United States showed a decline of 10.3% in the month of March, which was previously expected to decline by 9.2%. This weakened the US dollar across the board and aided in the upward movement of gold prices.
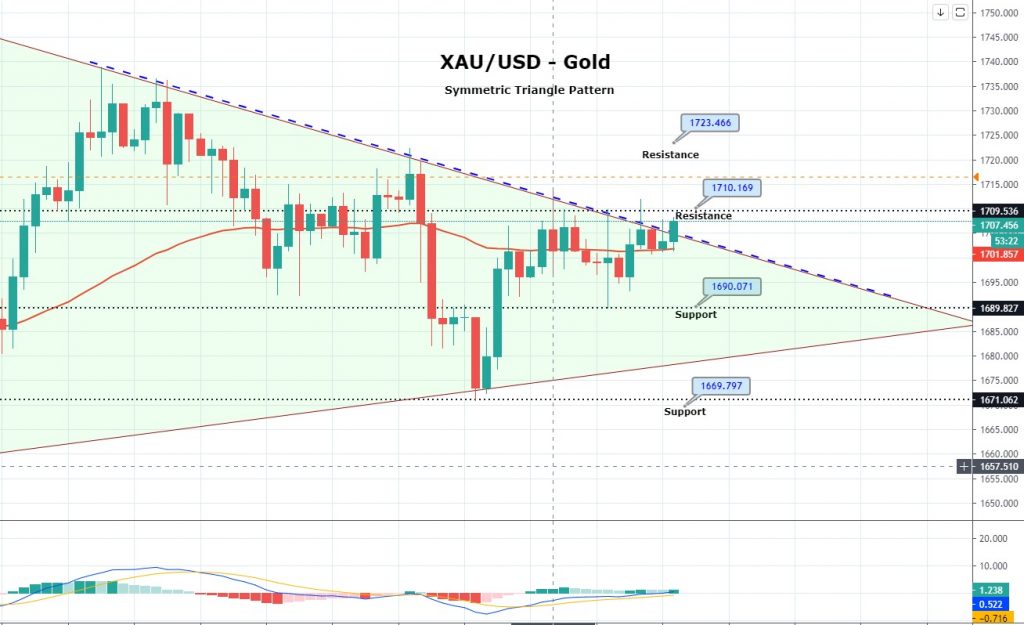
On the technical front, gold has crossed below 50 periods EMA which is providing resistance around 1,711 level. Recent closing of bearish engulfing on the 4-hour timeframe suggesting investor’s bias towards selling. On the higher side, a downward trendline may also extend resistance around 1,712, and below this level, we may see selling until 1,690 and 1,683 level today while buying can be seen until 1,723 on bullish breakout.
Good luck!
- Check out our free forex signals
- Follow the top economic events on FX Leaders economic calendar
- Trade better, discover more Forex Trading Strategies
- Open a FREE Trading Account
- Read our latest reviews on: Avatrade, Exness, HFM and XM
Related Articles


Sidebar rates
Related Posts
