USD/CAD Descending Triangle Breakout – Is it Going After 1.3610?
The USD/CAD has violated the descending triangle pattern at the 1.3550 level, and above this, the next resistance is likely to be met at...
What’s up, traders?
The USD/CAD pair closed at 1.35391, after placing a high of 1.35633 and a low of 1.35193. Overall the movement of the USD/CAD pair remained bearish throughout the day. The USD/CAD pair continued its previous day’s declines and fell for the 3rd consecutive day on Tuesday, on the back of a weak US dollar, due to improved risk sentiment in the market and rising WTI Crude Oil prices.
The global market optimism rose after the release of positive data from the United States on Tuesday. The better-than-expected US Services sector data gave a push to the US & global equities, which raised the risk-sentiment in the market, weighing on the US dollar. The US dollar index also fell, and the US Treasury yields remained steady, while major US stocks, including NASDAQ, Dow Jones and S&P 500 futures posted gains on the day.
At 18:45 GMT, the Final Services PMI from the US for June came in at 47.9, against the forecast 47.0, lending support to the US dollar. At 19:00 GMT, the closely-watched ISM Non-Manufacturing PMI from the United States showed an expansion in the services sector, by releasing at 57.1 for June, compared to the 50.0 that was forecast.
On the crude oil front, the WTI Crude Oil prices rose above $41 per barrel on Monday, due to increased energy demand from across the world. The rising crude oil prices strengthened the commodity-linked Loonie, which ultimately weighed on the USD/CAD pair. Meanwhile, a Bank of Canada survey was released on Monday, showing that business sentiment in Canada was strongly negative, even though coronavirus restrictions have been eased. However, half the surveyed companies expected a rise in their sales, which were likely to recover to pre-pandemic levels within 12 months.
The widespread negative sentiment induced by the coronavirus lockdown and the drop in oil prices led the Bank of Canada’s business outlook indicator to drop sharply, close to the lower levels experienced during the global financial crisis in 2007-09. The Bank of Canada surveyed about 100 companies between May 12 and June 5, as part of its first regular survey since pandemic concerns intensified. The Bank of Canada reduced its interest rates three times in March, to 0.25%, and its next interest rate release is set for mid-July. The Bank of Canada Business Outlook Survey also provided strength to the Canadian dollar, weighing on the USD/CAD pair and adding further to the downward movement of the USD/CAD pair on Tuesday.
Daily Technical Levels
Support Resistance
1.3515 1.3564
1.3492 1.3590
1.3466 1.3613
Pivot Point: 1.3541
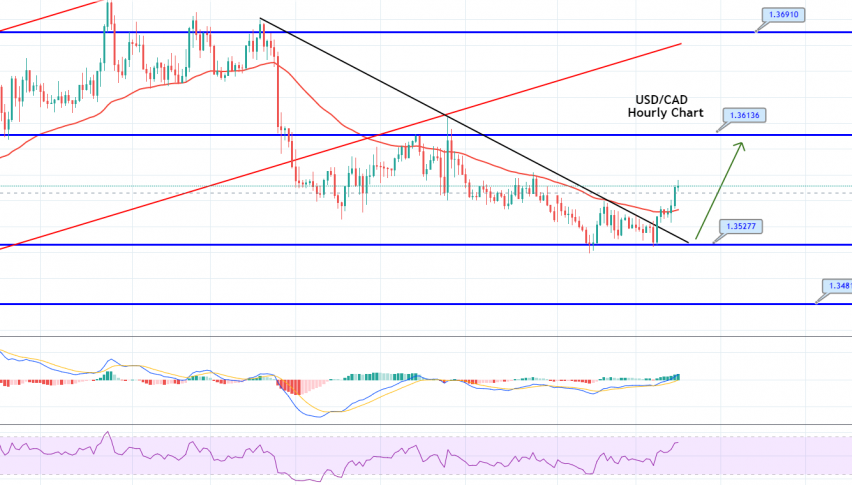
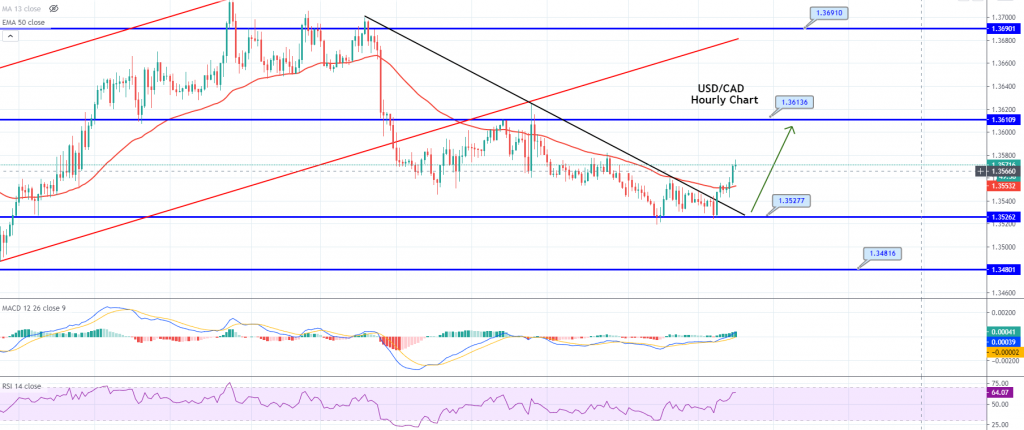
The USD/CAD has violated the descending triangle pattern at the 1.3550 level, and above this, the next resistance is likely to be met at around the 1.3610 level. A continued bullish trend could trigger more buying, until the 1.3660 level, while support is likely to remain within the 1.3480 range. The RSI and MACD support buying trends, which is why we took a bullish trade, to target 1.3598. Good luck!
- Check out our free forex signals
- Follow the top economic events on FX Leaders economic calendar
- Trade better, discover more Forex Trading Strategies
- Open a FREE Trading Account
- Read our latest reviews on: Avatrade, Exness, HFM and XM
Related Articles


Sidebar rates
Related Posts
