Crude Oil Bounces Off the 200 SMA, After Hitting Our TP Target
Crude Oil has climbed back up, after finding support at the 200 SMA again
Crude Oil has been bullish for several months now, as the demand increased with the global reopening. The uptrend has been constant during the first couple of months, with lows getting higher and highs making new highs. But in the last two months buyers have been having trouble making new highs, which shows that the buying pressure is erroding for US WTI crude.
Although, the lows keep getting higher, so buyers still remain in charge. During the climb of the last few months, moving averages have been doing a great job in providing support during pullbacks lower on the larger time-frame charts, such as the daily and H4 time-frames.
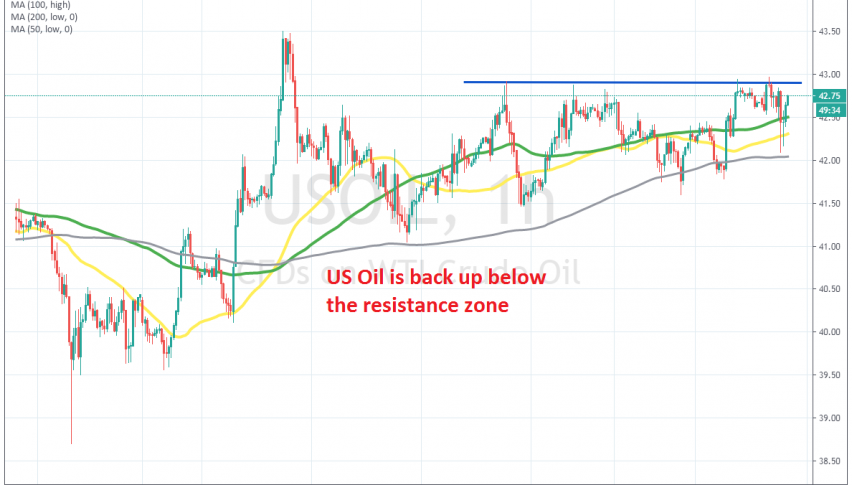
But, a resistance zone has formed below $43, after the spike to $43.50 earlier this month, where buyers have failed for a couple of weakes. Yesterday we decided to open a sell forex signal below $43, after buyers failed for the second time and the price formed another doji candlestick below the resistance area, which is a reversing signal.
US crude Oil turned lower eventually, hitting our take profit target at $42.20. But, the price formed a doji candlestick on the H1 chart, above the 200 SMA (grey) which has been providing support before for Oil. This time the doji ws a bullish reversing signal and crude Oil has jumped higher again now. So, buyers remain in charge again now, but let’s see if they will be able top break the resistance, If not, then we might sell again up there.
- Check out our free forex signals
- Follow the top economic events on FX Leaders economic calendar
- Trade better, discover more Forex Trading Strategies
- Open a FREE Trading Account
- Read our latest reviews on: Avatrade, Exness, HFM and XM
Related Articles

Sidebar rates
Related Posts
