Weekly 62% Fibonacci Support In View For GBP/USD
With one forex trading week left in April, the GBP/USD is approaching a key 62% Fibonacci support level (1.3798).
The U.S. dollar is in a holding pattern today as “tax-hike mania” appears to be dying down. Thursday brought an intense buzz over the new Biden tax plan and a subsequent retracement in American stocks. Now, the markets are rebounding, led by a stable USD and uptick in the U.S. equities indices. For the GBP/USD, rates are up slightly on the day (+0.06%) and within a stone’s throw of a key Fibonacci support level.
It has been a quiet week on the U.S. economic calendar. The lack of market drivers has been tough on the Greenback, as global majors have cut into 2021’s losses vs the USD. However, there are a few items worth looking at this morning:
Event Actual Projected Previous
Markit Composite PMI 62.2 NA 59.7
Market Manufacturing PMI 60.6 60.5 59.1
New Home Sales 1.021M 886K 846K
New Home Sales (MoM) 20.7% 12.0% -16.2%
The key takeaway from this group of figures is the 20.7% month-over-month increase in New Home Sales. Of course, this is a rebound number from February’s downturn. Right now, the jury is still out on 2021’s U.S. real estate market. Although demand for housing will remain strong and mortgage rates low, expectations are extremely high. Will they be met?
All in all, today has been a muted forex session for the Greenback. Nonetheless, there may be a buying opportunity brewing in the GBP/USD.
Fibonacci Support In View For The GBP/USD
With one week left in April, the GBP/USD is approaching a key 62% Fibonacci support level (1.3798).
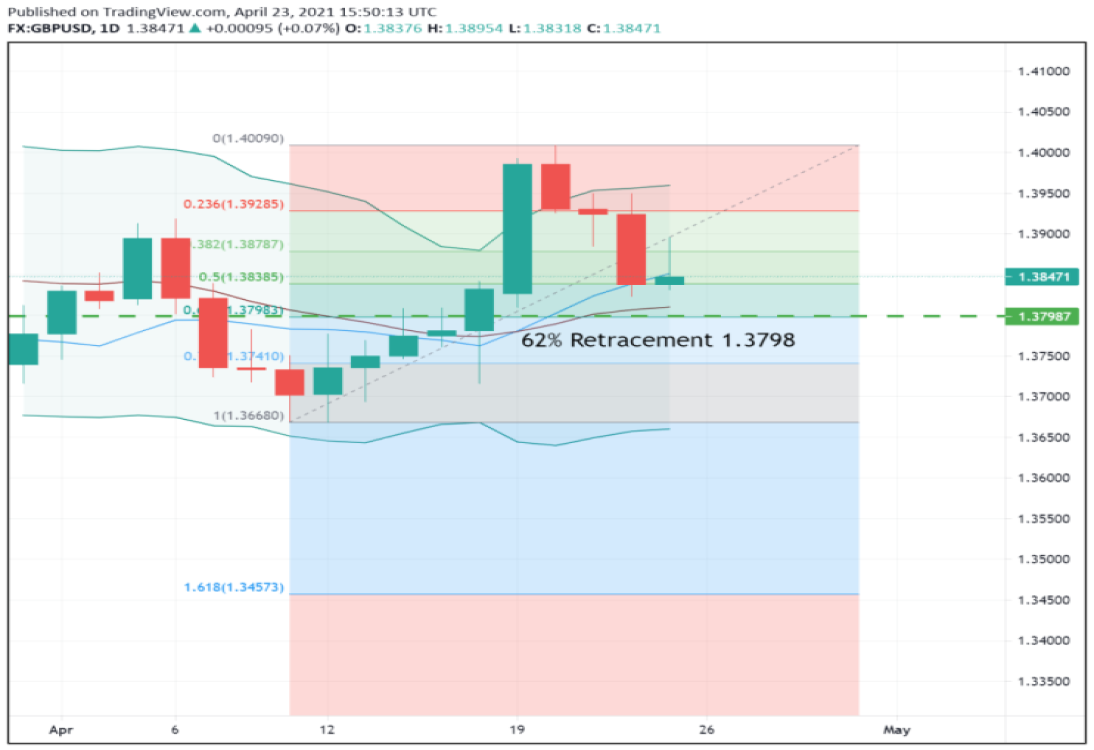
Bottom Line: The 62% current wave retracement is setting up to be formidable support for the GBP/USD. If we see a test of this level in the coming days, a buying opportunity may come into play. As long as 1.4009 is the high-water mark in this market, I’ll have buy orders queued up from 1.3809. With an initial stop loss at 1.3769, this trade yields 40 pips on a standard 1:1 risk vs reward management plan.
- Check out our free forex signals
- Follow the top economic events on FX Leaders economic calendar
- Trade better, discover more Forex Trading Strategies
- Open a FREE Trading Account
- Read our latest reviews on: Avatrade, Exness, HFM and XM
Related Articles
Sidebar rates
Related Posts
