GBP/USD Reverses Down, Despite the UK GDP Growing
GBP/USD failed to break the resistance and reversed down after the UK GDP report
The UK economy wa one of the hardest hit during the last coronavirus lockdowns and other restrictions in the winter. But, the UK economy is quite resilient, recovering fast after the lockdowns are over. The GDP report released earlier today showed a decent expansion in April, following another decent month in March.
But, today’s report missed expectations slightly and GBP/USD is reversing down, after it failed to break the 100 SMA (green) on the H4 chart. Now, this pair is trading around 40 pips lower form the top. This pair has formed a resistance zone around 1.42, which looks like a god place to sell this pair, although we missed the opportunity this morning.

GBP/USD fails at the resistance zone at 1.42 again
UK April GDP Report by ONS – 11 June 2021
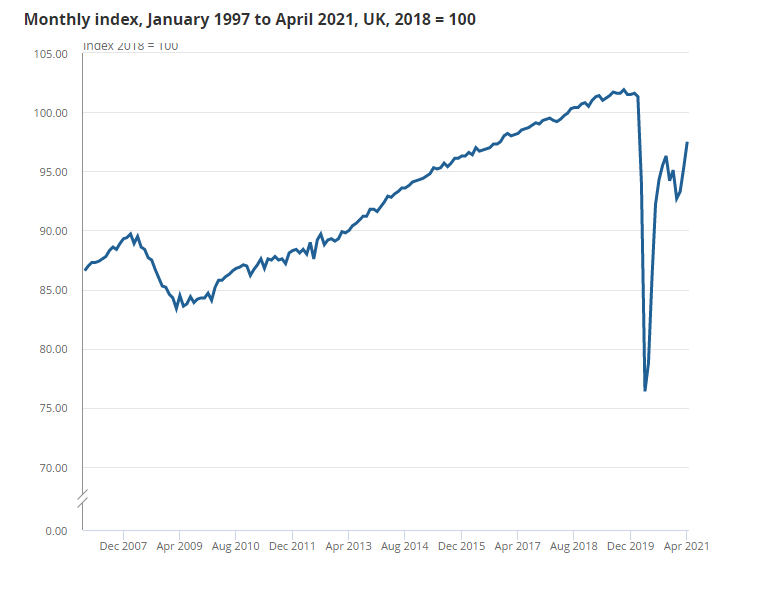
- April monthly GDP +2.3% vs +2.4% expected
- March GDP was +2.1%
- GDP QoQ +1.5% vs +1.6% expected
- Prior GDP QoQ was -1.5%
GBP/USD Live Chart
The readings are more or less in-line with estimates and that provides a bit of a taste of the bounce in economic activity as virus restrictions were eased. Given how things have progressed in recent weeks, expect more of a pickup in May and June as well.
- Check out our free forex signals
- Follow the top economic events on FX Leaders economic calendar
- Trade better, discover more Forex Trading Strategies
- Open a FREE Trading Account
- Read our latest reviews on: Avatrade, Exness, HFM and XM
Related Articles


Sidebar rates
Related Posts
