Oil Facing Major Support at the 50 SMA, as Growing Concerns About Restrictions and the OPEC Deal Send WTI Below $70
Crude oil is now looking increasingly similar to cryptocurrencies, which tumbled lower after a strong bullish trend, with a seemingly never-ending decline. The drop in crude oil has only started in the last two weeks, but it has caught quite a few traders on the wrong side.
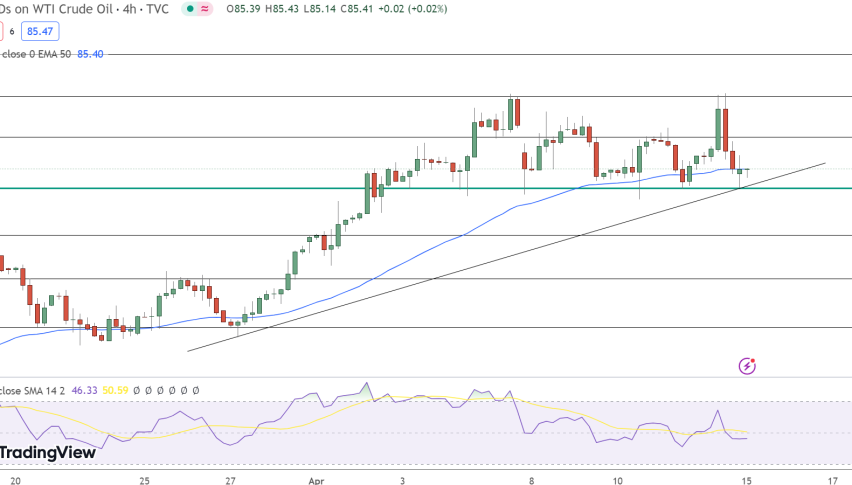
Some were expecting the pullback to end at $71, which didn’t happen, while others were expecting the $70 level to hold as support. That didn’t happen either and the price cut through it like a knife through butter. The 50 SMA was another major support indicator, which had held before during March, April and June.

WTI crude oil has broken the 50 daily SMA
Now the price is trading at the 50 SMA on the daily chart, so that remains as the ultimate support at the moment. If that moving average gets broken, then it will open the door for the 100 SMA, which stands at $66.50.
Crude Oil Fundamentals Look Bearish
Stock markets are declining as concerns over the new coronavirus variants increase fears of further restrictions in Europe and North America. S&P500 futures are down 53 points, just ahead of the open, with Dow futures down 518 and Nasdaq futures 134 points underwater. The German index DAX30 opened with a bearish gap downwards, and it continues to fall. It is now trading around 700 points off last week’s highs, which were record highs.
So, the sentiment has turned bearish and risk currencies are also down, with safe haven ones, such as the CHF and the JPY, being bullish right now. Besides that, OPEC+ seems to be coming to an agreement on increasing oil production in the coming months, which keeps weighing further on the crude oil prices. At the moment, US WTI Crude Oil is trading at $67.70, so the 50 SMA on the daily chart seems to have been broken, unless oil makes a pullback and closes the day above it, which would be more than $1 higher.


