EUR/GBP Continues Lower, Despite the Soft UK GDP
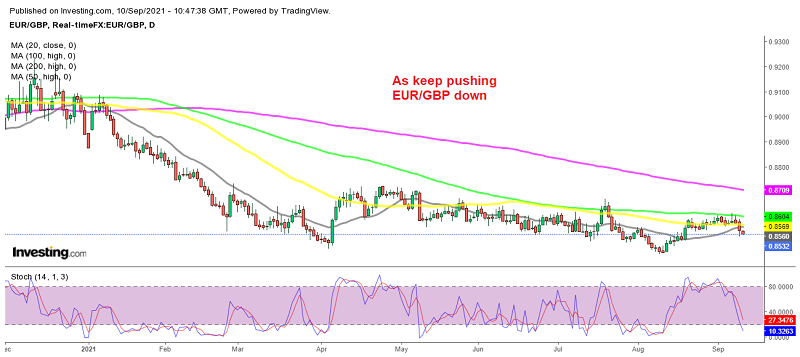
EUR/GBP has reversed at the 100 daily SMA and the lower UK GDP is not helping it
The UK economy came out of trouble pretty late in spring, after all the restrictions in the country. After the US economy, the Eurozone economy followed them up, with manufacturing and services surging in summer, while the recovery of the UK economy followed after that in Europe. But now, we see that the recovery didn’t last long, and the economy is heading down again.
The monthly GDP almost fell flat in July, while construction output declined. Manufacturing also fell flat, so everything looks bad, apart from industrial production, even though, the GBP continues its bullish move, which has been sending the EUR/GBP lower. In August we saw a retrace higher on the daily chart, but the 100 SMA (green) held as resistance at the top, and now the price has reversed back down, so the bearish trend continues in the EUR/GBP.
Latest data released by ONS – September 10, 2021
- July GDP MoM +0.1% vs +0.6% expected
- June GDP was +1.0%
- GDP QoQ 3.6% vs +3.8% expected
- Prior GDP QoQ was +4.8%
- Construction output -1.6%
- Previous construction output was -1.3%
- Manufacturing July 0.0% against 0.1% expected
- June manufacturing was 0.2%
- Industrial production 1.2% against 0.3% expected
- Prior industrial output was -0.7%
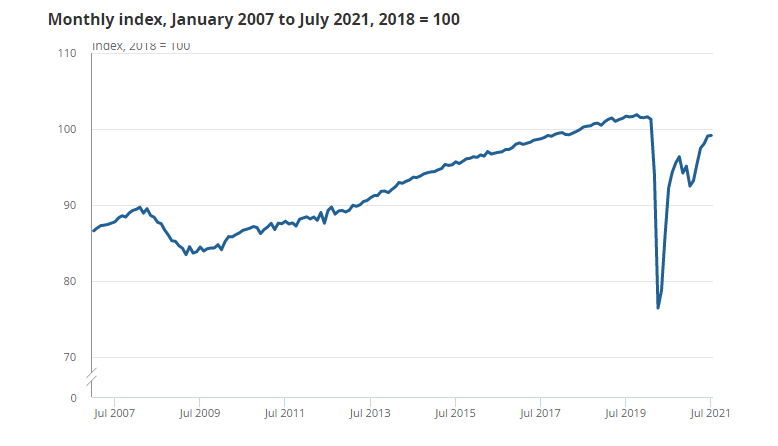
The reading missed expectations quite a bit, and if anything, it reaffirms that growth conditions in the UK peaked during the summer months, and a more sluggish momentum is expected towards the latter stages of Q3. Looking at the details, production output (+1.2%) was the biggest contributor to GDP growth in the month, while services output was broadly flat, remaining 2.1% below the figures for February 2020 i.e. the pre-pandemic level.
EUR/GBP Live Chart
- Check out our free forex signals
- Follow the top economic events on FX Leaders economic calendar
- Trade better, discover more Forex Trading Strategies
- Open a FREE Trading Account
- Read our latest reviews on: Avatrade, Exness, HFM and XM
Related Articles


Sidebar rates
Related Posts
