Solana (SOL/USD) is Still Bearish, but the Breakout is Imminent
Since hitting a fresh high of about $215 on September 9, Solana seems to have run out of gas. The cryptocurrency has maintained a bearish momentum since then. Any attempt to move higher has been muted, with sellers taking it lower. At the time of writing, SOL/USD was consolidating at a new-found support of around $152.
Solana Network Crash
On Monday, Solana tried to surge higher, moving from the $152 support to a high of around $179 on the same day. However, the gains were erased the following day, after a network outage saw it shed more than 15% in only 12 hours.
At the moment, SOL/USD seems to have found its footing, and it has managed to resist any attempt to break below the $152 support, which implies that a new bullish momentum could be on the horizon. Nonetheless, we need to confirm a break-out before any buying entries.
SOL/USD – A Technical Outlook
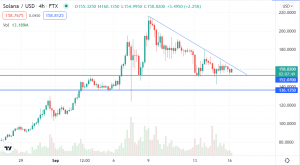
Solana 4-Hour Chart Analysis
Looking at the 4-hour chart, we can see that SOL/USD is trapped between a descending trendline and support at $152, with the trendline and the support forming a descending triangle. The digital token is approaching a breakout point, which could offer further clues on its trading in the next few days.
SOL/USD Trade Idea
Scenario 1
If SOL/USD holds onto the $152 support, a buy trade would be on the horizon. I expect the crypto token to break above the descending trendline, ushering in a new bullish momentum. The target would be the previous highs at around $190 and $215.
Already, cryptocurrencies are showing bullish turns, which means a break above the descending trendline is possible. At the time of writing, major cryptocurrencies Bitcoin, Ethereum and Cardano, were already up 2.98%, 7.33% and 3.95% respectively, in the last 24 hours. Solana was down 1.33% in the same period, but recovering from the 24.04% drop in the last seven days.
Scenario 2
We cannot completely rule out the possibility of SOL/USD breaking below the $152 support. If this happens, it could head up to the next potential support at $136. However, we need to watch the candle closure, preferably on the daily chart, in order to confirm a continuation of the bearish momentum, via a bearish trade signal, such as a pin bar.
Summary
I continue to hold a bullish view on SOL/USD, based on the ongoing recoveries in the crypto market. However, I will only enter a buy trade after a sufficient break above the descending trendline. If SOL/USD were to break below the support area, I would be keen on the next target at $136. Happy trading!
- Check out our free forex signals
- Follow the top economic events on FX Leaders economic calendar
- Trade better, discover more Forex Trading Strategies
- Open a FREE Trading Account
- Read our latest reviews on: Avatrade, Exness, HFM and XM
Related Articles


Sidebar rates
Related Posts
