Solana Coin (SOL) Approaches An Important Support Zone, Fantom Crypto (FTM) Finds Support Already
Solana coin and particularly Fantom crypto getting closer to a bullish reversal, as technical indicators show
Solana and Fantom has been among the most bullish cryptos during the last several weeks, especially in September as they surged higher. Solana formed a support area above $22 and started the march from there. The smaller moving averages such as the 20 SMA (gray) and the 50 SMA (yellow) were providing support on the H4 chart, as shown above, pushing the price higher.
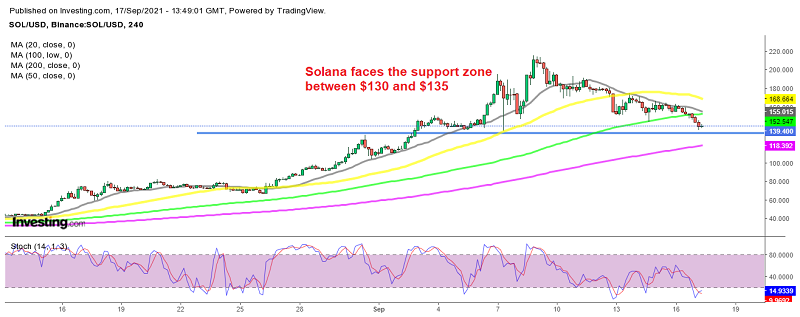
SOL/USD reached $217 on my crypto broker’s platform and was remaining bullish even after the crypto market crashed on Tuesday last week, which was the beginning of another bearish phase in the crypto market. Moving averages have been broken and the 20 SMA (gray) has turned into resistance for Solana, which is now pushing it lower.
Solana Analysis Daily Chart – SOL/USD Braking Below the 20 SMA

Now let’s see if the support zone will hold
On the daily chart, we see that the bullish momentum came to an end above $200 for Solana and it started reversing down after forming a hammer/evening star candlestick at the top, which is a bearish reversing signal. The 20 daily SMA was broken after providing some mild support, but now the price is approaching an important zone.
The area between $130 and $135 has been acting as support and resistance before, so it is likely that it does that job again now. Solana approached it earlier today and it is already pulling back up. So, this might be a good area to look into buying this cryptocurrency. We are already long on Solana, so we are not taking another trade here.
Fantom Daily Chart – FTM/USD Finds Support at the 100 SMA

FTM/USD stuck between MAs on the H4 chart
Fantom also surged, especially during September, reaching a high of $1.99 after coming from a low of $0.14 in July. Smaller Moving averages were doing a good job here too, especially the 20 SMA on the H4 chart. But, they were eventually broken and turned into resistance.
At least the 100 SMA (green) holds as support; we saw a bounce off this moving average earlier this week and today it is acting as support again. So perhaps FTM/USD will bounce off this moving average. I am trying to open a buy trade on Fantom and this place seems pretty good, so let’s go.
- Check out our free forex signals
- Follow the top economic events on FX Leaders economic calendar
- Trade better, discover more Forex Trading Strategies
- Open a FREE Trading Account
- Read our latest reviews on: Avatrade, Exness, HFM and XM
Related Articles


Sidebar rates
Related Posts
