Tezos, Cardano Back to Bearish Markets? Look at These Crystal Clear Signs

Tezos (XTZ/USD) Breaks Below Support
The crypto token Tezos (XTZ/USD) started October strong, rising to a new all-time high above 9 on October 4. The token seemed to be benefitting from the bullish sentiment in the rest of the crypto industry. It also got a boost from a series of upgrades it has gone through this year.
XTZ/USD retreated to the 7.3 support on October 6 and is still looking sharp towards the upside, to a high of 8.4. However, it has remained subdued since then. The XTZ/USD broke below the support in a bearish push, as attention shifted from altcoins to Bitcoin, on the back of the projected approval of a BTC ETF in the US.
At the time of writing, XTZ/USD was trading at 6.78, and looking increasingly bearish in a market characterized by lower highs and lower lows.
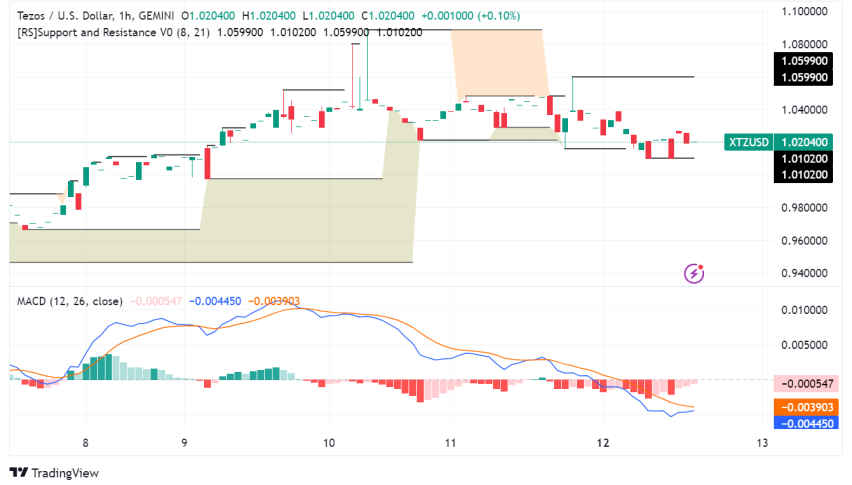
– A 4-Hour Technical Outlook
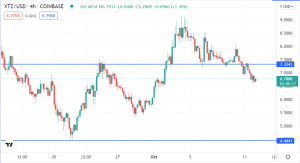
From the technical analysis above, it can be seen that XTZ/USD is proceeding lower. Although it is a bit early to conclude that the bearish market is back for XTZ/USD, we can ascertain that the crypto token is coming under increasing selling pressure, with the potential destination being lower levels.
XTZ/USD Trade Idea
I recommend sell trades, as long as XTZ/USD continues to hold below 7.3, which is now the new resistance. It is important to wait for prices to retreat towards the resistance in the current bearish momentum, and to enter trades at a more appropriate point that gives a better risk-reward ratio.
Sell trades taken at or near the resistance should target the next most likely support at 5.5, or potentially even lower, at 5.0.
ADA/USD Breaks Out of a Wedge Pattern
Since touching a monthly low of 1.9 on September 21, Cardano (ADA/USD) has tried to move higher. However, the upside has been sluggish, and ADA/USD has failed to reclaim the former glory that saw it post an all-time high of slightly above 3.0 on September 2.
The slow recovery of ADA/USD has seen it maintain a choppy bullish move, resulting in a wedge pattern. Now, ADA/USD has broken out of this wedge pattern, and to the downside, ushering in a potential bearish move in the coming days.
– A 4-Hour Technical Outlook
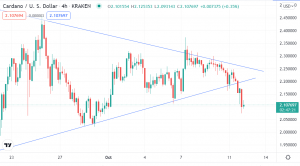
From the 4-hour chart, it is evident that ADA/USD has already broken out of a wedge pattern.
Now, the key question to ask is: should you trade the breakout on ADA/USD?
ADA/USD Could Find Support at 2.02
Breakouts can be traded comfortably, as they offer some of the clearest signs of the direction of the market. However, looking at ADA/USD, the breakout happened at about 2.2, slightly above the 2.02 support. This means that we might only see a short-term bearish move before prices consolidate or bounce back.
ADA/USD Trade Idea
I recommend we wait and monitor the ADA/USD price behavior at 2.02, to see whether prices continue to fall, and if they find support at this level. If prices fail to break below the 2.02 support, we would consider buy entries, after sufficient confirmation through price action trading signals, such as a pin bar. It is also important to monitor the overall crypto sentiment before entering any buy trades.
If ADA/USD breaks below the 2.02 level, we could welcome a bearish momentum that might push prices up to 1.68 or perhaps lower. Happy trading!
- Check out our free forex signals
- Follow the top economic events on FX Leaders economic calendar
- Trade better, discover more Forex Trading Strategies
- Open a FREE Trading Account
- Read our latest reviews on: Avatrade, Exness, HFM and XM
Related Articles

Sidebar rates
Related Posts
