Crude Oil Flushes Weak Stops Below $80, But Starts to Reverse Higher
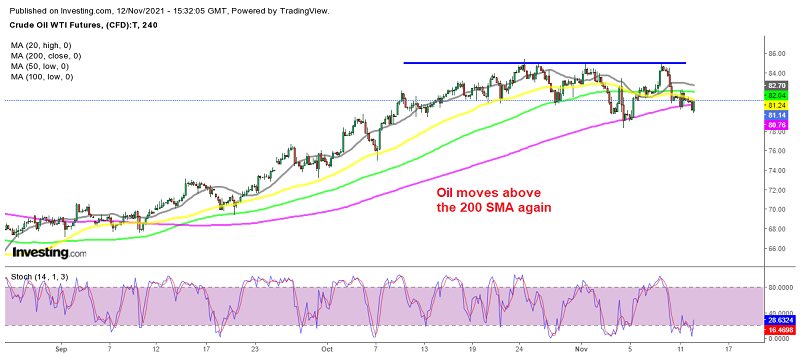
Crude Oil which has been on a massive bullish trend climbed above $85 toward the end of October, but since then it hasn’t been above to climb above that level anymore. In fact, a resistance zone has formed around that level. Signs of exhaustion in oil? Perhaps.
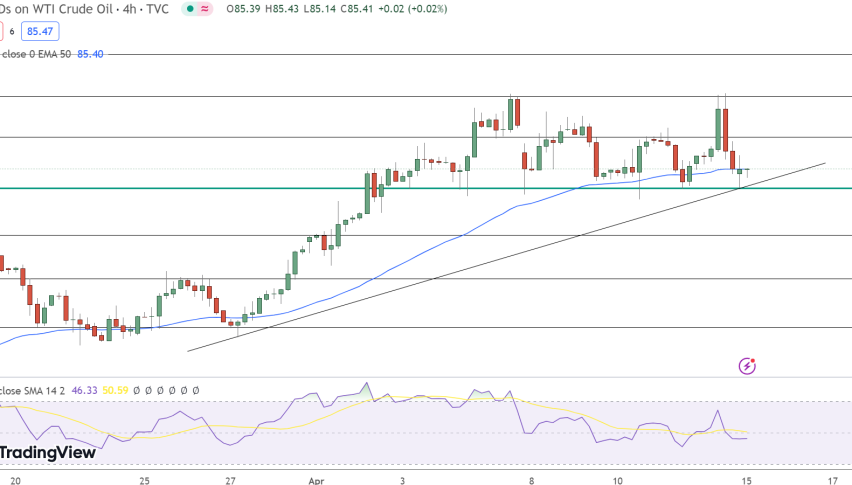
The inability for buyers to firmly break above $85 is seeing price slowly track lower in the past few sessions following the big drop on Wednesday. The sluggishness is continuing with price now down another 2% today to $79.80 levels. We are long from $80.65 and now WTI OIl is trading above $81 again after flushing some weak stops below $80.
US WTI Crude Oil Live Chart
The positive takeaway for buyers is that price is managing to keep above the key psychological level of $80. But there has been a struggle to seize back near-term momentum with the key hourly moving averages limiting gains near $82 since yesterday.
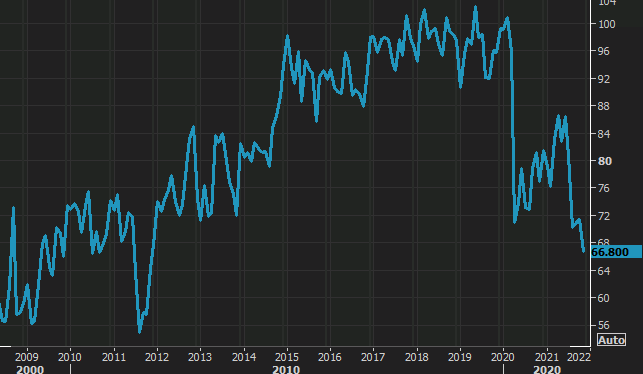
Consumer sentiment from the University of Michigan

- US November UMich prelim consumer sentiment 66.8 vs 72.4 expected
- Final October reading was 71.7
- Current conditions 73.2 vs 77.7 prior
- Expectations 62.8 vs 67.9 prior
- 1-year inflation 4.9% vs 4.8% prior
- 5-10 year inflation 2.9% vs 2.9% prior
This is the lowest in a decade and the University of Michigan noted that one-in-four consumers cited inflationary reductions in their living standards. Half of households anticipated reduced real incomes next year. The caveat in this report is that there are major partisan political differences. More than anything, it reflects the political mood and increasing hyper-partisanship around everything in the US.
Highlights of the job openings and labor turnover survey
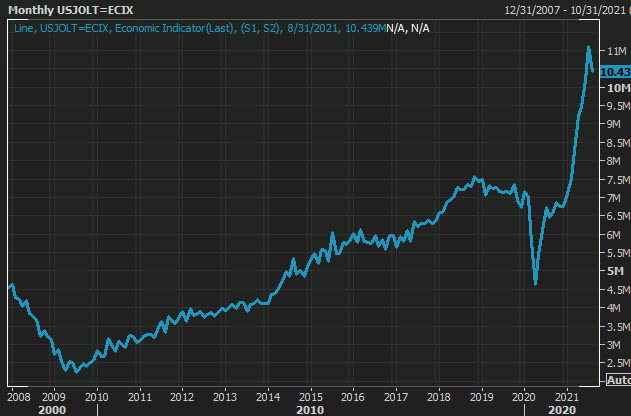
- September JOLTS job openings 10.438M versus 10.300M estimate
- Prior was 10.439M (revised to 10.63M)
- Job openings 10.438M vs 10.3. 10.63
- Hires were little change at 6.459 million. Last month the hires came in at 6.497M
- Separations little change at 6.218 million. Last month total separations came in at 6.032M
- Quits increase to 4.4 million (+164,000 on the month). That was the highest level for quits
- Layoffs and discharges little change that 1.4M
Of note is there’s been a structural, technology-driven change in hiring. Companies now spam job postings and are always hiring at the low end of the wage scale, even if it means letting someone go who is making more. There’s a new reliance on automated, algorithmic resume sorting that’s created a glut of both and skews the picture.
The quits rate is now the most valuable part of this survey and it shows some improvement. The largest quits in September came from arts, entertainment, and recreation (+56K), other services (+47K), state and local government education (+30K). Quits decreased in wholesale trade (-30K).
From the BLS:
Large numbers of hires and separations occur every month throughout the business cycle. Net employment change results from the relationship between hires and separations. When the number of hires exceeds the number of separations, employment rises, even if the hires level is steady or declining. Conversely, when the number of hires is less than the number of separations, employment declines, even if the hires level is steady or rising.
Over the 12 months ending in September 2021, hires totaled 73.3 million and separations totaled 67.7 million, yielding a net employment gain of 5.6 million. These totals include workers who may have been hired and separated more than once during the year


