Fantom (FTM), Kadena (KDA), Cardano (ADA) Price Prediction – Retreating Before Turning Bullish?
Technical and Fundamental analysis for Fantom FTM, Cardano ADA and Kadena KDA
Cryptocurrencies turned bullish in October, most of which made some decent gains while some surged higher. Early this month cryptos retreated while last week things got interesting again as the crypto market surged initially and then retreated back. Fantom coin, Kadena and Cardano are in the midst of a retreat but the pullback might be coming to an end soon, so let’s have a look at these cryptos.
Fantom Daily Chart Analysis – Ready to Resume the Uptrend?
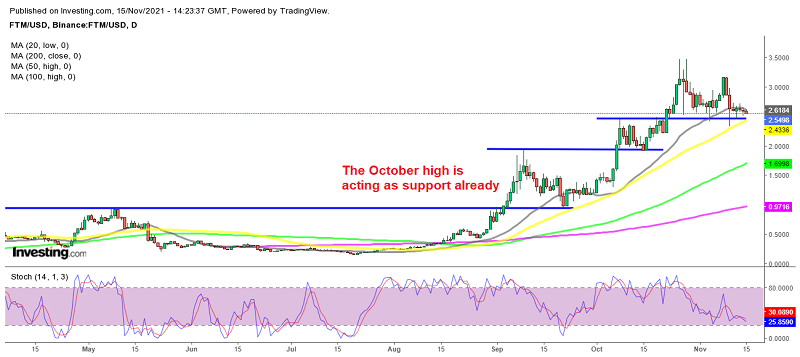
Fantom turned massively bullish since late July breaking above May’s highs and surging more than 20 times. Moving averages turned into support for this cryptocurrency, but what’s more interesting is the fact that the previous highs keep turning into support for FTM/USD.
Right now, we are right above the early October high at $2.50, which is already acting as a support zone. The 50 SMA is also catching up, so the retreat should be over soon and the bullish trend should resume again. The 20 SMA (gray) is acting as resistance right now, but we are keeping our FTM/BTC signal open, waiting for the bullish trend to resume again soon.
Cardano Daily Chart Analysis – The 50 SMA Turns Into Resistance Again for ADA

The 20 and 50 SMAs resume the job as resistance in ADA
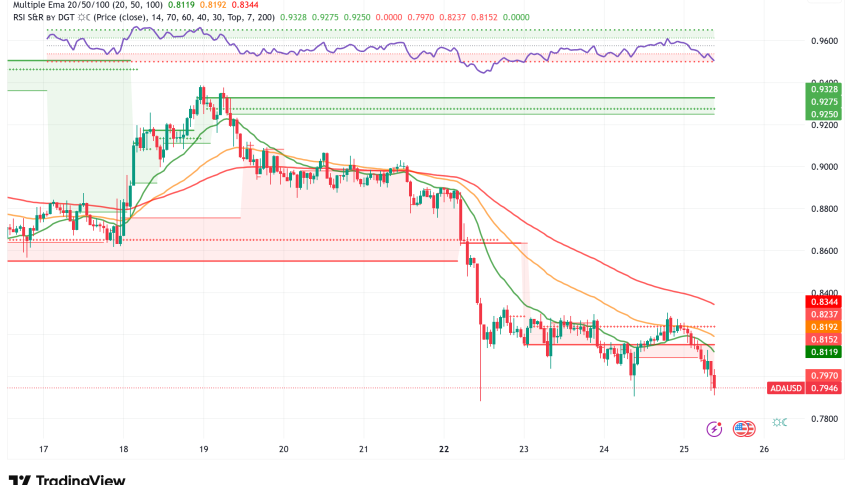
Cardano turned quite bullish in August, making new all-time highs, but it turned bearish in September and has been one of the most bearish cryptos since then. It trended lower even in October when most of the market turned bullish, showing increasing weakness as it kept making lower lows.
Moving averages were acting as resistance, pushing the highs lower, particularly the 220 SMA (gray) and the 50 SMA (yellow). The 100 SMA (green) was acting as support for some time, but it was eventually broken, so the 200 SMA remains as the line in the sand now. Early last week we saw a surge higher, but the 200 SMA turned into resistance, so the pressure remains to the downside for this crypto. Everything is going well with the Alonzo update for Cardano, but it is not helping the price action and the 20 and 50 SMAs have turned into resistance again.
Cardano Coin ADA Live Chart
Kadena Daily Chart Analysis – Will the Surge Resume Once the 20 SMA Catches Up?
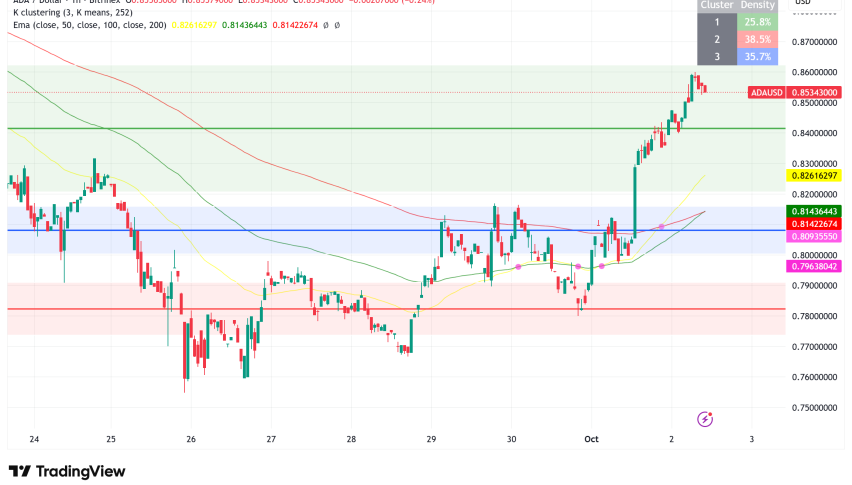
Kadena followed the crypto market higher in October, but this month it turned parabolic, as the price surged from $6 to almost $30, leaving behind all moving averages which haven’t been able to catch up even during the 50% retreat earlier this month, before it pushed higher to a new high. This has led to the popularity increasing and now it is being listed on crypto exchanges such as CoinMetro and Crypto.com.

KDA/USD retreating after the major surge
Kadena is launching the wrapped Kadena (WKDA) to Ethereum, a compatible decentralized finance (DeFi) protocol. Because of that, the daily trading volume increased from an average of $3 million to more than $345 million. Besides that, Kadena will expand to other Layer-1 blockchains such as Polkadot, Cosmos, Terra Money etc. So, the rally is expected to resume again soon, probably once the 20 SMA (gray) catches up with the price on the daily chart for KDA/USD.
- Check out our free forex signals
- Follow the top economic events on FX Leaders economic calendar
- Trade better, discover more Forex Trading Strategies
- Open a FREE Trading Account
- Read our latest reviews on: Avatrade, Exness, HFM and XM
Related Articles

Sidebar rates
Related Posts
