Fantom (FTM) Heads for New Highs, Kadena Crypto (KDA) Trading in the Uncertain Zone
Kadena crypto remains uncertain, Fantom has turned bullish again
The cryptocurrency market continues to remain uncertain after the bearish reversal in the last two months of 2021. Most of the cryptocurrencies are consolidating sideways, a few are still slipping lower, while very few are bullish. Fantom crypto is one of the coins which are not wasting time and making the most, while the Kadena coin is retreating.
Fantom Daily Chart Analysis – FTM Breaks the Second Resistance Level
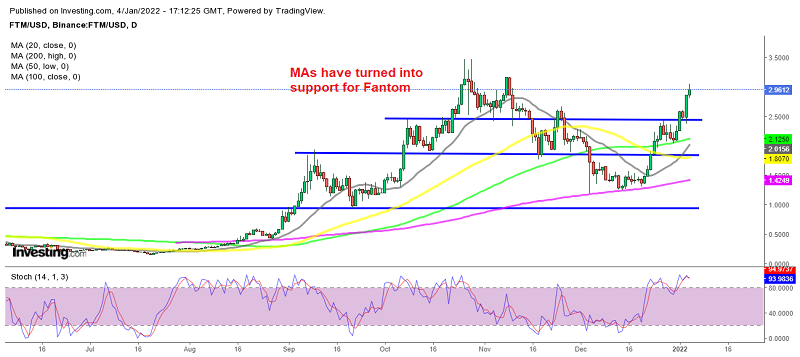
Fantom crypto turned quite bearish in November, after the big surge in the previous three months which took the price to $3.50 by late October. The same way it went up in waves, Fantom came down in waves, with the previous resistance zones turning into support.
First, the support around $2,50 was broken, then came the turn of the support around $2. The price was heading for the final support zone at $1 but the 200 daily SMA (purple) was in the way and it stopped the decline. That moving average held for a while and eventually, the bullish trend resumed. The support at $2.50 turned into resistance and rejected the price initially but the 100 SMA turned into support and FTM/USD turned bullish again, pushing to $3. So, now FTM is within sight of all-time highs and shouldn’t be long before it gets there. We are already long on FTM/BTC, riding that move up.
Kadena Daily Chart Analysis – KDA Fails at the Second Resistance

The 100 SMA is providing support again for Kadena crypto
Kadena wasn’t showing particular strength until late October, when it surged more than 10 times higher until early November. KDA/USD surged to $28.50, but then the sentiment turned bearish in the crypto market and all cryptocurrencies reversed lower.
Kadena fell to around $6 by the middle of December, but the real support came at around $8.50. That level was the high in October and it held well, aided by the 1000 SMA (green) as well on the daily chart. The price bounced off that support and climbed to $18 by the end of December, piercing the 50 daily SA (yellow) as well. but, the price reversed back down. But, the 100 SMA seems to be holding again as support at $10. This is not a bad place to go long, although $8.50 is a better place, so we are following the price action to see if we can buy down there.
- Check out our free forex signals
- Follow the top economic events on FX Leaders economic calendar
- Trade better, discover more Forex Trading Strategies
- Open a FREE Trading Account
- Read our latest reviews on: Avatrade, Exness, HFM and XM
Related Articles

Sidebar rates
Related Posts
