Terra (LUNA/USD) Forms Bullish Pin Bar on Key Level, Polygon (MATIC/USD) Heading to $1?

LUNA/USD Rejects Decline Below Ascending Trendline
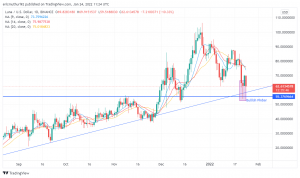
On a crypto market day characterized by a liquidation bloodbath, Terra’s native token, LUNA/USD, has been no exception. The token has lost more than 24% in the past week and at the time of writing, it was trading down by at least 10% in the foregoing 24 hours. Nonetheless, at the current trading price of $61.75, LUNA/USD is coming from a market drop that saw it touch a low under $55. Amid the bearish market sentiment, LUNA/USD has flashed a key signal that points to a potential rebound at the key support.
Outlook on the Daily Chart
LUNA/USD Rebounding from $55 Level?
On the daily chart above, the decline in LUNA/USD was rejected at the $55.3 level, which acted as support before. A long bullish pin bar can be seen towering above, as the token bounced off the support, with prices rising up to $70 over the weekend. What makes the bullish pin bar promising is that it forms right above the support and ascending trendline, leaving a confluence of bullish signals that we should be keen on. Nonetheless, the 9-day, 14-day and 20-day moving averages remain above the current price, which suggests that we could witness some market indecision or consolidation before we witness a strong upside.
LUNA/USD Trade Idea
A clear buy signal is present on LUNA/USD at the current level, with prices firmly holding onto the $55 support. However, with the ongoing crypto weakness, I recommend we wait a little for further confirmations that the $55 will continue to hold. A change in the sentiment in the broader crypto could also add a bullish impetus that will further validate the bullish signal on the daily chart.
Polygon (MATIC/USD) Could Head to $1 Next
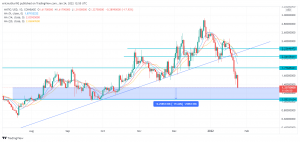
After remaining on an uptrend on the daily chart up to January 18, Polygon’s native token MATIC/USD seems to have finally given in to the bearish pressure engulfing the crypto market. In our previous outlook, we indicated that MATIC/USD was facing bearish pressure as it approached the ascending trendline quickly. Our projection was that MATIC/USD will maintain the bearish momentum if it breaks below the trendline.
After continued weakness, MATIC/USD broke below the ascending trendline on January 19, and it is currently on a free fall. At the current trading price of around $1.3, MATIC/USD is showing no signs of abating, as the established support sits way below that, at $1.05.
– Technical Outlook on the Daily Chart
MATIC Could Slide to $1.05
Looking at the daily chart, MATIC/USD is under heightened bearish pressure, as it continues to drop towards the established support of $1.05. All the moving averages provide resistance above that.
Based on the technical pointers, MATIC/USD will continue to fall, until $1.05 if the bulls do not take charge at the current $1.3, which seems to be a market event area, but not an established support. Therefore, we need a little bit of patience to allow the price to settle, potentially at $1.05, before entering a buy trade. Good luck!
- Check out our free forex signals
- Follow the top economic events on FX Leaders economic calendar
- Trade better, discover more Forex Trading Strategies
- Open a FREE Trading Account
- Read our latest reviews on: Avatrade, Exness, HFM and XM
Related Articles


Sidebar rates
Related Posts
