Gold Price Forecast: Safe-haven Demand Pushes XAU/USD to $1,950
The precious metal gold has been trading in a narrow range of $1,911.10-1,941.56 for the past week, but it now appears to be breaking out of
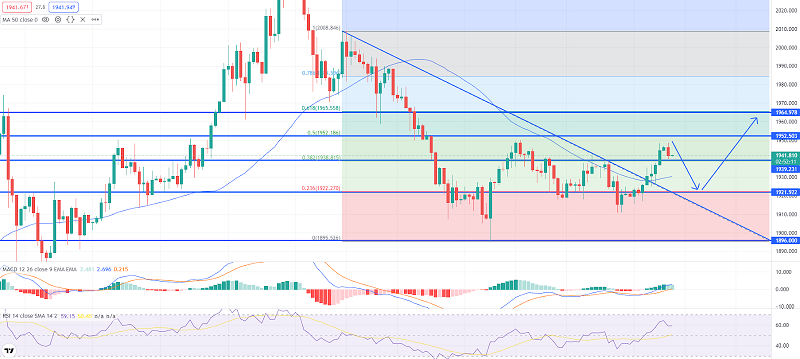
The precious metal gold has been trading in a narrow range of $1,911.10-1,941.56 for the past week, but it now appears to be breaking out of the woods and rallying further, despite headwinds from the Federal Reserve’s (Fed) policymakers’ hawkish stance. Despite rising odds of a 50 basis point (bps) interest rate hike by the Fed, the precious metal GOLD appears to be supported by market participants.
In her speech on Wednesday, San Francisco Fed Bank President Mary Daly stated that interest rates may settle around 2.5 percent, which will be required to contain soaring inflation. On the other hand, Cleveland Fed Bank President Loretta Mester advocated for the Fed to raise interest rates by 50 basis points more than once by the end of 2022. However, the Fed members’ aggressive tightening stance failed to tighten gold prices.
The US dollar index (DXY) has been stuck near 98.50 and is waiting for a new wave of risk-aversion to attract bids. Meanwhile, 10-year US Treasury yields have experienced minor weakness after reaching a new two-year high of 2.42 percent.
On Thursday, the economic calendar is jam-packed with major events. The US docket will release Initial Jobless Claims, Durable Goods Orders, and the Markit (Manufacturing and Services) PMI on Thursday. However, the focus will remain on the EU leaders’ summit to discuss the Russian oil embargo and US President Joe Biden’s meeting with NATO counterparts to discuss Russia-Ukraine tensions and a diplomatic solution.
Gold (XAU/USD) Technical Analysis
The XAU/USD has broken out of the falling channel, sending gold prices near $1,945. The upper end of the falling channel is marked by the high of March 17 at $1,949.80, while the lower end is marked by the low of March 18 at $1,918.21. The Relative Strength Index (RSI) (14) oscillates between 60.00 and 80.00, indicating that the bullish trend is likely to continue. The 21-period Exponential Moving Average (EMA) of $1,937.15 will significantly support the counter. Good luck!
- Check out our free forex signals
- Follow the top economic events on FX Leaders economic calendar
- Trade better, discover more Forex Trading Strategies
- Open a FREE Trading Account
- Read our latest reviews on: Avatrade, Exness, HFM and XM
Related Articles


Sidebar rates
Related Posts
