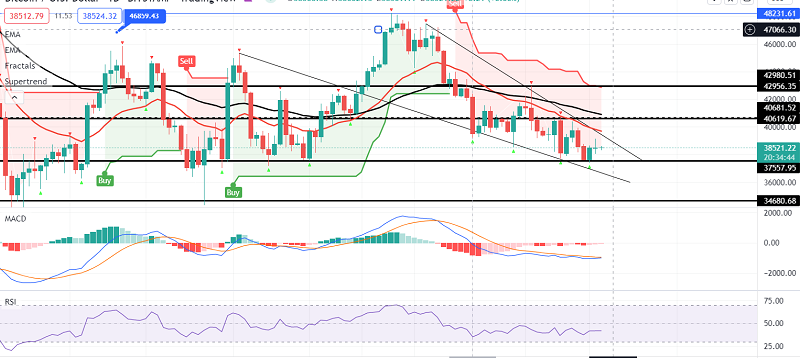
Bitcoin Price Prediction – Double Bottom Underpins at $37,500
Bitcoin is struggling to break through the $38,800 barrier against the US dollar. If BTC remains below the $39,000 pivot level, it could fall significantly. BITCOIN is battling to break through the $38,800 and $39,000 resistance levels.
The price is currently trading below $38,600 and the 100 hourly simple moving average. On the hourly chart of the BTC/USD pair, a major contracting triangle is forming with resistance near $38,880. The pair must break through the $38,880 and $39,000 resistance levels to begin a decent rise.
Bitcoin Price is Looking for the Next Break
Bitcoin price found support near $37,400 and began a recovery wave. BTC was able to reclaim the $38,000 level and gradually increased its value. A clear move above the 23.6 percent Fib retracement level of the key drop from the $40,350 swing high to the $37,400 low was observed. The price attempted to break through the $38,800 resistance level and the 100 hourly simple moving average.
However, bitcoin’s price has struggled to rise above $39,000. It also failed to settle above the pivotal drop’s 50% Fib retracement level from the $40,350 swing high to the $37,400 low.
Furthermore, on the hourly chart of the BTC/USD pair, a major contracting triangle is forming with resistance near $38,880. It is currently encountering resistance near the $38,600 level and the hourly simple moving average.
The next significant resistance level could be around $38,880. A close above $38,880 and $39,000 could pave a decent increase. The price could even break through the $39,250 resistance in the stated scenario. The next major stumbling block is seen near the $40,000 level.
Another Drop in BTC?
If Bitcoin fails to break through the $38,880 resistance level, it may begin a new decline. On the lower side, there is immediate support near the $38,400 level. The next major supports are the triangle lower trend line and the $38,200 level.
If the price falls below the triangle support, it may even fall below $38,000. The next significant support level is $37,400, below which the price could fall to $36,500. Good luck!


