Forex Signals Brief for July 13: US Inflation and BOC 75 bps Rate Hike After RBNZ 50 bps Hike
Yesterday’s Market Wrap
Yesterday we saw a continuation of the price action for the previous day, as risk sentiment remained negative for most of the day, keeping risk assets down. The USD advanced against most major currencies, seeing EUR/USD drop to parity at 1.0000 during the European session.
Although sellers stopped there and in the US session we saw another bounce like yesterday, the downtrend continued as the Euro remained bearish, after the ZEW economic sentiment turned even more negative this month, indicating a coming recession. Crude Oil finished the day at last week’s lows after a $7 decline as China’s Covid restrictions continue, while the global economy heads into recession.
The Data Agenda Today
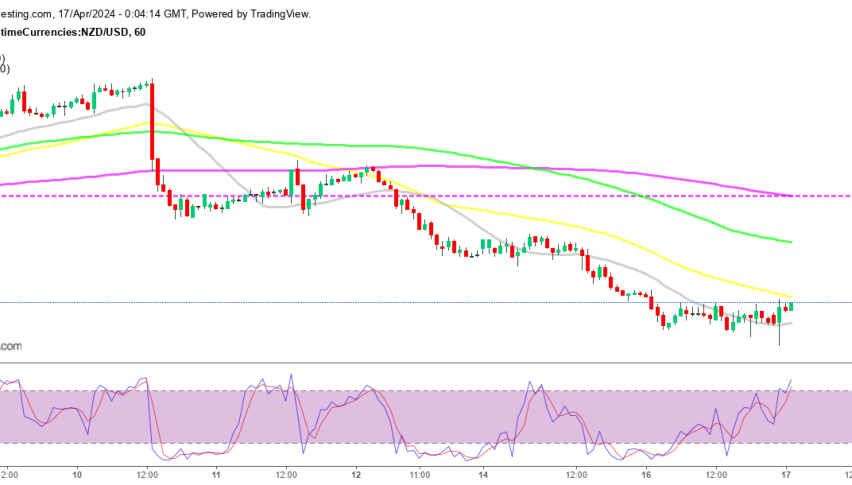
Early today the Reserve Bank of New Zealand delivered the third 50 bps rate hike, while the UK GDP report was released a while ago. Later in the European session, the EU will publish its economic projections, which should be another negative factor for the Euro, while the US CPI report which is the most important piece of data since it will be an important factor for FED’s rate decision next week. The Bank of Canada (BOC) is already expected to raise rates by 0.75% later today, while the US WTI crude Oil inventories will probably send Oil lower if they show another large buildup like the one we saw last week.
Forex Signals Update
Yesterday we continued the positive run with our forex signals, after opening several forex signals and a crypto signal as well and only losing one. We took advantage of the uptrend in the USD and went long against other currencies, which proved to be a good strategy, as we left several more signals open but close to the take profit target.
GBP/USD – Sell Signal
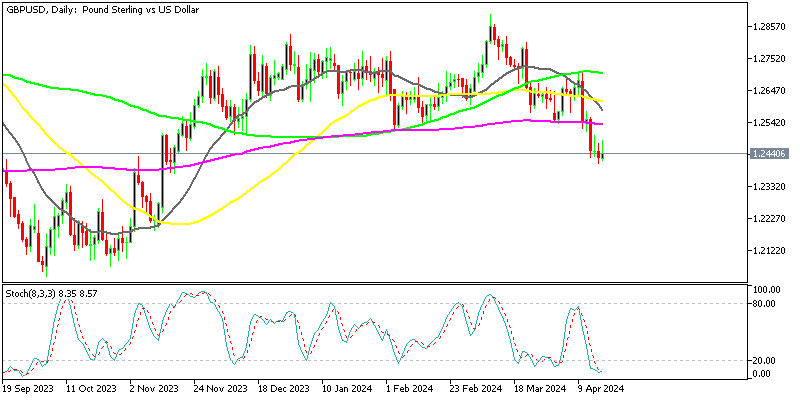
GBP/USD has turned quite bearish as expectations are for the UK to fall into recession as well, as prices keep surging while the BOE keeps raising interest rates. Moving averages have been acting as resistance at the top, pushing the price lower and we have been trying to sell retraces higher to these moving averages. We decided to open a sell signal after the retrace higher and the rejection by the 50 SMA (yellow) which closed in profit yesterday.

GBP/USD – 60 minute chart
USD/JPY – Buy Signals
Yesterday USD/JPY pulled back down after the surge on Monday as the Bank of Japan head Kuroda pledged to keep the monetary policy loose to help the economy, while the FED has been raising rates pretty fast. We have been buying pullbacks during every retrace, but yesterday we got caught during the retrace but opened another buy signal above the 20 SMA on the H4 chart which closed in profit this morning.

USD/JPY – 240 minute chart
Cryptocurrency Update
Cryptocurrencies continue to trade in a range after last week’s bullish momentum ended during the weekend and since Sunday the crypto market has been bearish. They continued lower yesterday as well, and we decided to open another sell trade in digital currencies which ended up in profit.
Booking Profit in BITCOIN Again
After the bullish move failed late last week, Bitcoin started reversing lower on Sunday and has been bearish for the last two days. The 20 SMA (gray) has been acting as resistance at the top and yesterday we decided to open yet another sell signal below that moving average after having a successful trade on Monday, which hit the take profit target as the price continued lower.

BTC/USD – H1 chart
MAs Pushing LITECOIN Down
Litecoin has been bearish since last November after a failed attempt to surge higher back then. Moving averages have been doing a good job as resistance indicators, pushing the price lower, with the 20 SMA (gray) taking over in recent months as the decline has accelerated. But buyers are putting up a fight and pushing Litecoin against the 50 SMA (yellow).

LTC/USD – Daily chart


