Bitcoin Crosses $21,000 – Quick Daily Outlook
Bitcoin began a steady rise just above the $21,000 resistance level against the US dollar. If BTC remains above the $20,500 support..
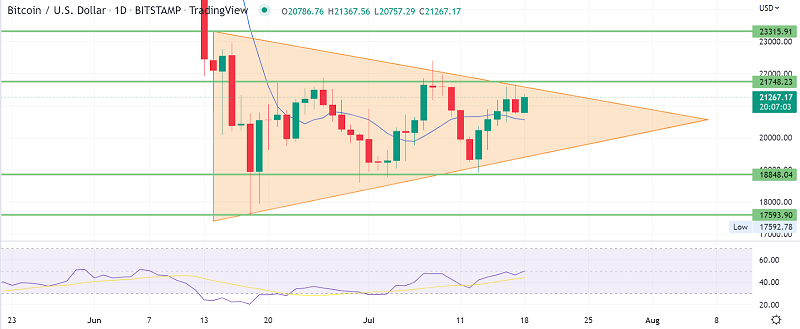
Bitcoin began a steady rise just above the $21,000 resistance level against the US dollar. If BTC remains above the $20,500 support, it could rise even further towards $22,000.
BITCOIN is gradually rising just above the $21,000 resistance mark. The price is now consolidating well above the $20,800 mark and is approaching the 100-hourly SMA.
On the hourly timeframe of the BTC/USD pair, there was a break beyond a short-term bearish trend line with resistance just next to $21,000. It may gain bullish momentum if the pair crosses through the $21,500 and $21,600 levels.
Bitcoin Recovers Above $21,000
Bitcoin price established a base above $19,200 and began a steady surge. The price moved into the bullish zone after trading above the $20,500 resistance zone. The price even accelerated above $21,000 and decided to settle above the 100 hourly simple moving average. Before the downside correction, a high was formed near $21,664. The price was trading below $21,000, but the bulls were active near the $20,750 area and the 100 hourly simple moving average.
The price has now risen after reaching a low near $20,748. It breached the 23.6 percent Fib retracement level of the decline from the swing high of $21,664 to the low of $20,748.
On the hourly timeframe of the BTC/USD pair, there was also a break above a short-term bearish trend line with resistance near $21,000. On the plus side, the bitcoin price may find resistance near $21,200. It is close to the 50% Fib retracement mark of the decline from the swing high of $21,664 to the low of $20,748.
The next major resistance level is around $21,500. A close just above the $21,500 resistance level could set the tone for a healthy gain. In the stated case, the price could rise to $22,000 or higher. The next major resistance is located near the $22,800 level.
Dips Accepted in BTC?
If Bitcoin fails to break through the $21,500 resistance level, it may begin a downward trend. On the downside, there is immediate support near the $21,000 level.
The next significant support is near the $20,750 level and the 100 hourly SMA. A clear break below the $20,750 support level could reduce the price to $20,500. Good luck!
- Check out our free forex signals
- Follow the top economic events on FX Leaders economic calendar
- Trade better, discover more Forex Trading Strategies
- Open a FREE Trading Account
- Read our latest reviews on: Avatrade, Exness, HFM and XM
Related Articles


Sidebar rates
Related Posts
