GBP/USD crashed below 1.04 in September as gilt yields surged higher, with the UK 10 year yields above 4%. But the Bank of England intervened and since then this pair has made a great comeback, although half the reason for this comeback is due to USD weakness.
Moving averages such as the 50 SMA (yellow) were providing resistance at the top, but they have been broken and turned into support immediately. The price climbed above 1.18 on Friday but retreated from last week’s highs after FED’s official Christopher Waller stated that a move of 50 bps is on the radar for December’s meeting and probably the meeting after that as well. So, risk sentiment turned bearish yesterday which capped the rally in this pair, as the USD gained some ground.
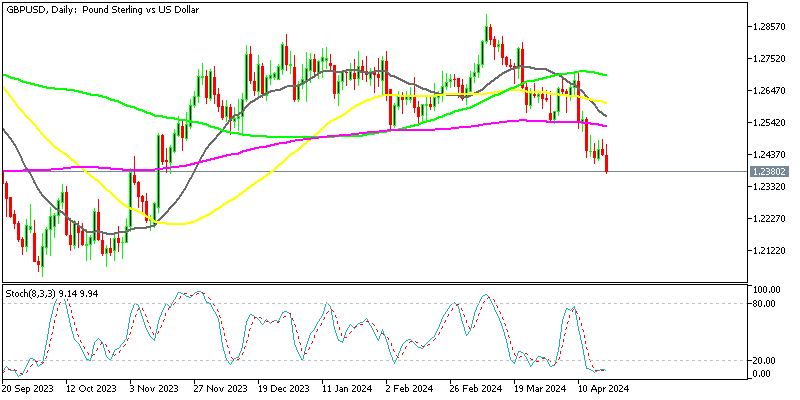
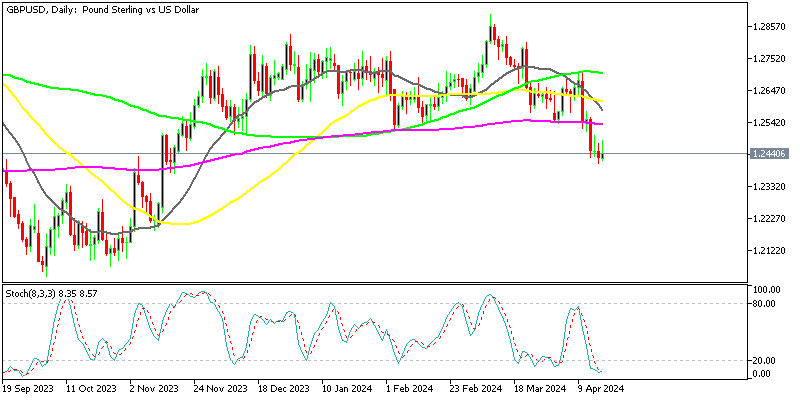
GBP/USD Daily Chart – The 100 SMA Has Been Broken

The price is more than 13 cents off the September lows now
Although, this pair is overbought on the daily chart, as the stochastic indicator shows. So, there is a chance that we might see a retreat from here before the next assault higher. In that case, we will see if the 100 SMA (green) will hold and turn into support. The UK earnings and unemployment report were released a while ago as well.
Latest data released by ONS – 15 November 2022
- October payrolls change +74k vs +69k prior
- Prior +69k
- September ILO unemployment rate 3.6% vs 3.5% expected
- Prior 3.5%
- September employment change -52k vs -25k expected
- Prior -109k
- September average weekly earnings +6.0% vs +5.9% 3m/y expected
- Prior +6.0%
- September average weekly earnings (ex-bonus) +5.7% vs +5.5% 3m/y expected
- Prior +5.4%
The number of payrolled employees in the UK increased by 74,000 in October to a record 29.8 million. There is a slight tick higher in the unemployment rate but overall, this still signals a strong momentum in the UK economy despite major economic headwinds in the works. Meanwhile, real pay growth continues to be a problem despite the higher estimates seen in weekly earnings. Real pay is estimated to be down 2.6% in the 3 months from July to September, relative to the same period a year ago (down from 2.3% last month).


