Gold Price Forecast As US Inflation Clues Take Center Stage
[[Gold]] has been on a roller coaster ride of gains and losses since the beginning of the year.
GOLD has been on a roller coaster ride of gains and losses since the beginning of the year. Some analysts believe that this is due to inflationary pressures in the US. There are many factors that could be causing these swings, but it seems that gold’s unpredictability might be due to how it is priced. GOLD is priced in US dollars, so when there is a stronger dollar, GOLD becomes more expensive, and vice versa.
GOLD has been trading sideways between the $1,800 and $2,000 range, despite a widely expected second weekly loss. Some of the large players have fled the market in recent weeks with view that more time is needed to decipher what direction GOLD might take. Thursday’s soft US jobless claims allowed Richmond Fed President Thomas Barkin to follow Federal Reserve Chair Jerome Powell and mark hesitance in raising the rates further.
The same scenario that helped the US Dollar of China being pegged and allowed the GOLD price to be stably floating up is now taking place again. The widest yield curve inversion since 1980 might lead to recession fears and cause the GOLD price to go on a downward journey at the moment.
Initial signs in the US inflation have been encouraging and the next week’s CPI will be vital for clarity. GOLD traders might lack conviction at the moment, but if US inflation expectations are met then this could all be very different.
Gold Technical Outlook
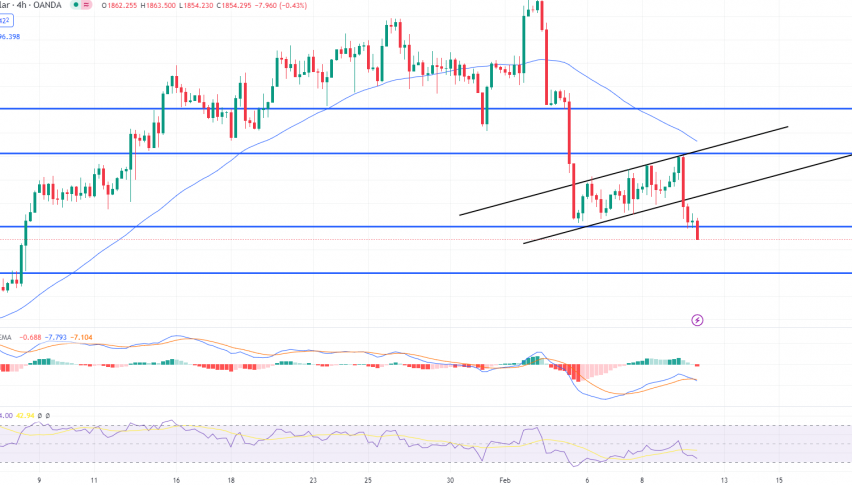
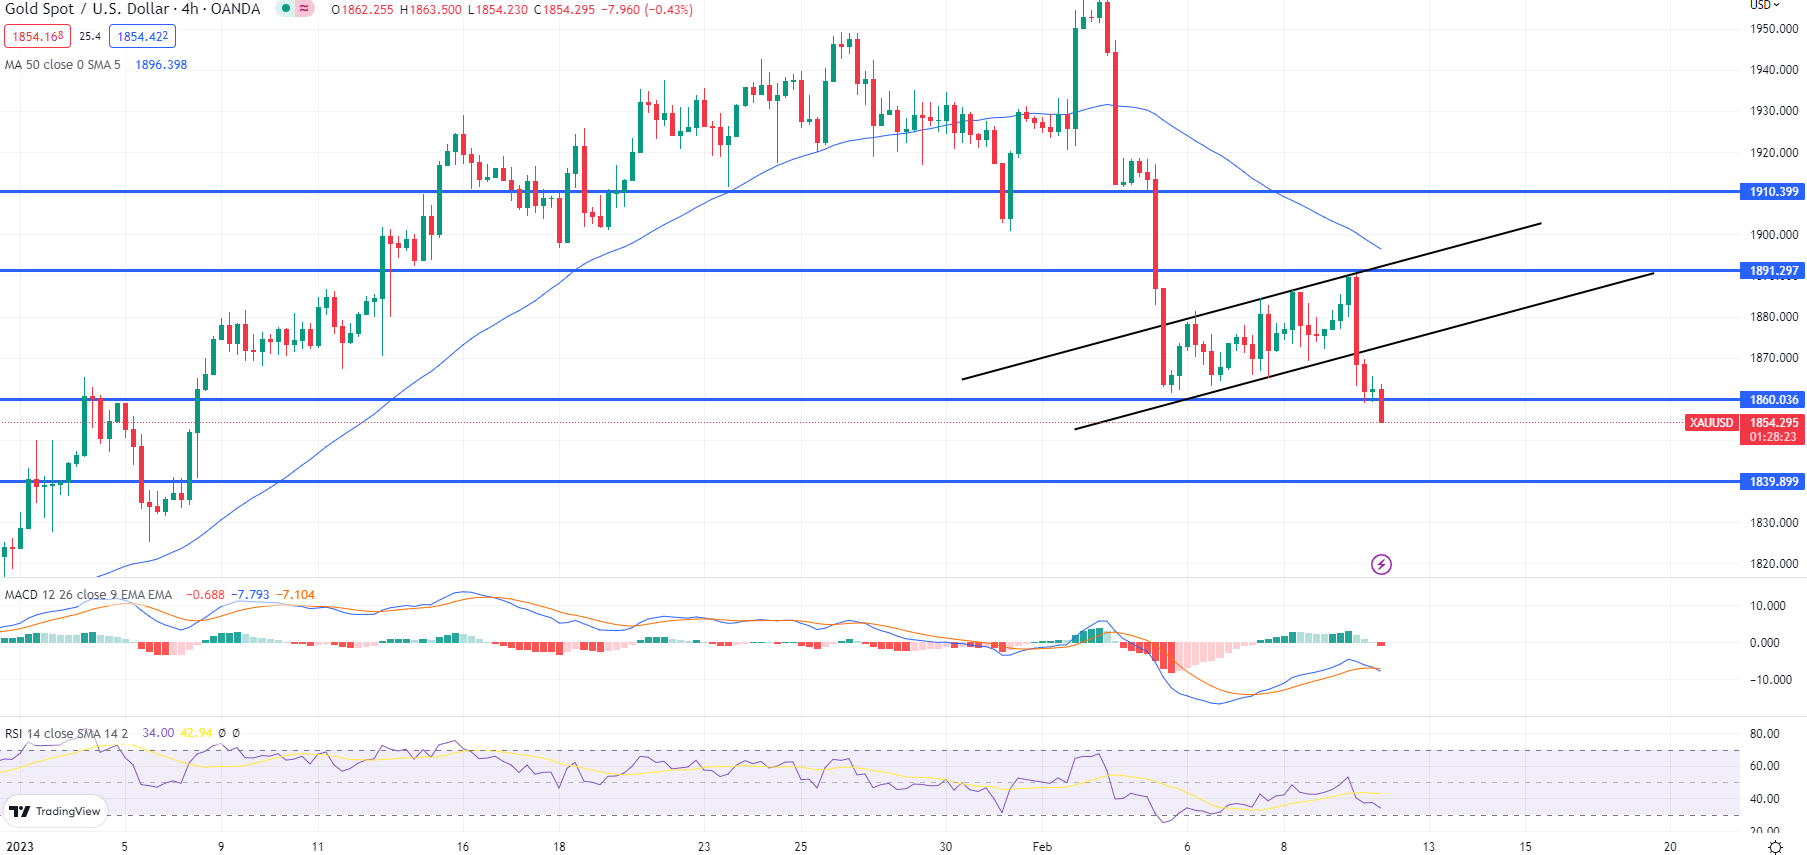
Gold’s technical indicators signal that the price grinds lower after breaking the $1,873 support, comprising Fibonacci 61.8% on one-day and the middle band of the Bollinger on the hourly play.
GOLD prices reached a downward convergence to the previous week’s low and bottom line of the Bollinger bands around $1800.
One pattern that can be discerned from the historical data shows a quick decline towards the $1,853 support confluence, which could occur in one month.
Alternatively, a successful break of the $1,873 hurdle will need validation from the $1,887 resistance level including the Fibonacci 23.6% on weekly to convince GOLD buyers. If the round figure of $1,900 gains major attention from the bulls, then that could lead to a substantial rally in XAU/USD.
- Check out our free forex signals
- Follow the top economic events on FX Leaders economic calendar
- Trade better, discover more Forex Trading Strategies
- Open a FREE Trading Account
- Read our latest reviews on: Avatrade, Exness, HFM and XM
Related Articles

Sidebar rates
Related Posts
