USD/JPY Analysis: Moving Averages, RSI Point to Further Losses
The USD/JPY currency pair is seeing a decline in sellers following a corrective recovery on Tuesday from a one-month low.
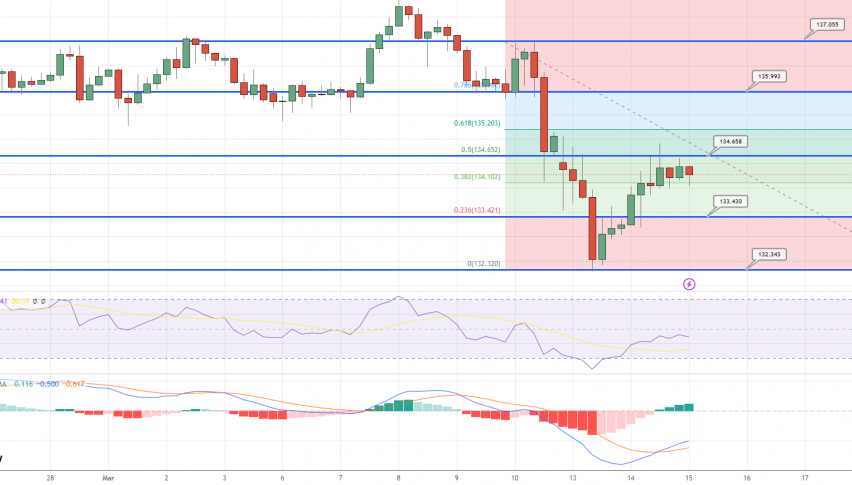
The USD/JPY currency pair is seeing a decline in sellers following a corrective recovery on Tuesday from a one-month low. However, buyers of the US dollar seem willing to revisit intraday lows around 134.00 on Wednesday, providing support for the bearish signals from the moving average crossover and negative RSI line at 14.
The 50-SMA’s downward push on the 100-SMA, combined with the bearish signal from the RSI, suggests further losses for USD/JPY . Yen bears face a horizontal support region between 135.90-85 that has remained strong for the past five weeks.
If USD/JPY drops below the 135.85 level, it could incur more losses and approach a two-month-old rising support line near 130.55. However, recent gains have been capped by a group of recent highs at 135.05-15 that have been in place since February 17.
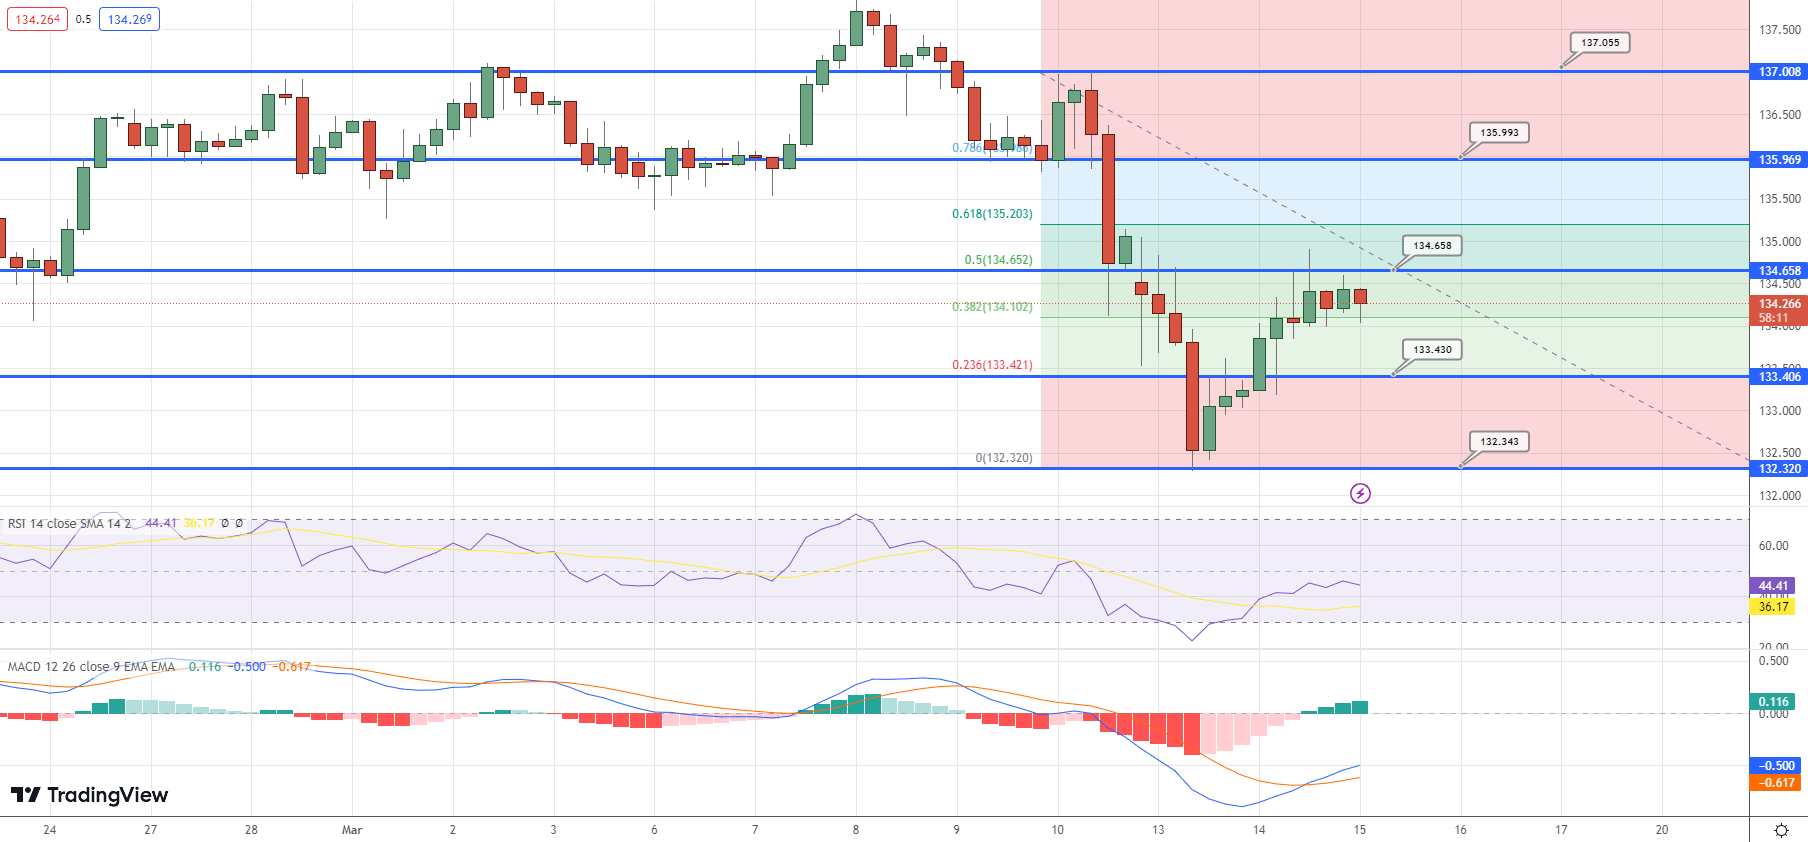
A critical convergence of the 50-SMA and the 100-SMA at 135.65-70 will be vital to observe as it may hold the key to a USD/JPY run-up towards the monthly high of 137.91, even if the quote follows positive MACD signals and surpasses the 135.15 barriers.
- Check out our free forex signals
- Follow the top economic events on FX Leaders economic calendar
- Trade better, discover more Forex Trading Strategies
- Open a FREE Trading Account
- Read our latest reviews on: Avatrade, Exness, HFM and XM
Related Articles


Sidebar rates
Related Posts
