Forex Signals Brief May 9: Waiting for FED Williams and Jefferson to Induce Volatility
Yesterday markets were quiet with the economic data being light, while today the calendar is lighter, but we're waiting for FED members
Yesterday’s Market Wrap
Yesterday was mostly quiet, with the UK and France being on a bank holiday, while the economic data was light. Although, the figures indicated that the global economy is still weakening, with industrial production falling by 3.4% in Germany last month, while the Eurozone Sentix investor confidence fell further into negative territory.
That didn’t affect markets much, as risk sentiment remained mostly positive as well, with the USD retreating lower, particularly during the European session. Crude Oil continued to push $2 higher above $73 after the bullish reversal late last week.
Today’s Market Expectations
Today the economic calendar is even lighter, with some minor data expected. Early this morning we had the Average Cash Earnings and Household Spending figures from Japan, as well as retail sales from Australia and trade balance from China, but none of them had much impact on the markets. The European session is very thin, while in the US session a couple of FED members will speak, which might spark some volatility.
Forex Signals Update
Yesterday the volatility was low after markets were very agitated last week, so we only managed to open three trading signals, all of them in commodities, such as Gold and crude Oil. Two of the signals closed in profit while the long-term Oil signal remains open.
GOLD Continues to Crawl Higher Again
Gold surged higher last week after bouncing off the 200 SA (purple) as the banking crisis resurfaced again, and pushed close to the all-time high after consolidating in a range since the middle of April. Although on Thursday we saw a reversal lower and Gold fell below $2,000 after the great US jobs report for April. Althugh buyers have come back and Gold crawled higher yesterday, hitting the TP target of our buy signal.

XAU/USD – 240 minute chart
Is the Retrace higher over for WTI Oil?
Crude Oil continued the reversal from late last week after the positive US employment report last Friday. But, the bullish momentum has faded now after buyers reached the 50 SMA (yellow) on the H4 chart, and we decided to open a sell Oil signal, since the stochastic indicator looks overbought now, so it is time for a retreat lower.

Crude Oil – H4 chart
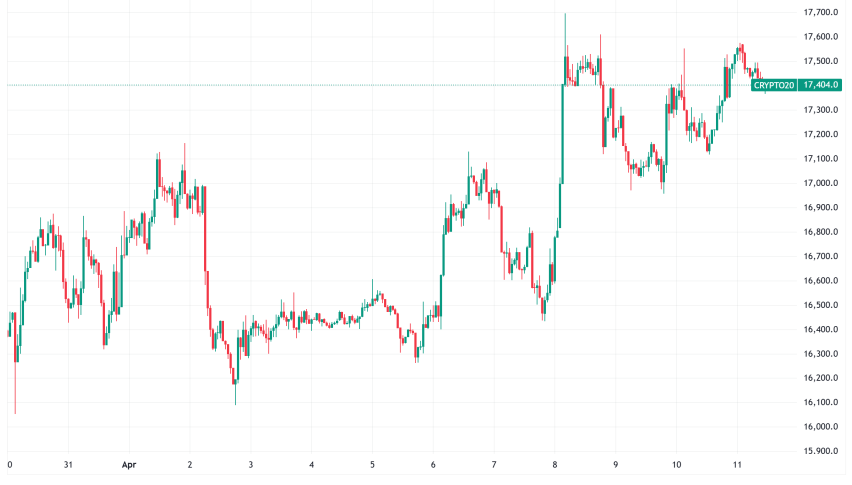
Cryptocurrency Update
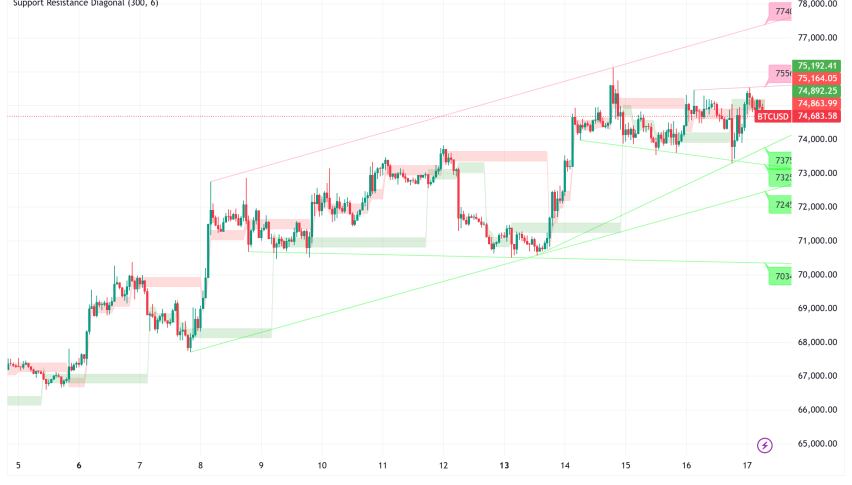
BITCOIN Breaks Below the 50 SMA
Bitcoin has been bullish since the beginning of this year, as highs kept getting higher, and last month buyers pushed the price above $30,000. The 50 SMA (yellow was acting as support on the daily chart during retraces lower, but that moving average was broken yesterday, oening the door for $25,000.

BTC/USD – Daily chart
ETHEREUM Remains Supported
Last week, the price of Ethereum dropped below $1,900, but it found support at the 50-day Simple Moving Average (SMA) at $1,800. This level acted as a support level, so we opened a buy signal for Ethereum as it looked promising. The 50 SMA provided support during the price retreat. Yesterday, Ethereum saw an increase in value, rising towards $2,000. However, the climb was halted by the 20 SMA (gray), which acted as a resistance level. This caused Ethereum’s price to reverse back down to the 50 SMA, which is still acting as a support level. It’s worth noting that technical analysis, such as the use of moving averages, can provide insights into potential support and resistance levels for a security. However, investors should always conduct their own research and consider multiple factors before making any investment decisions.

ETH/USD – Daily chart
- Check out our free forex signals
- Follow the top economic events on FX Leaders economic calendar
- Trade better, discover more Forex Trading Strategies
- Open a FREE Trading Account
- Read our latest reviews on: Avatrade, Exness, HFM and XM
Related Articles

Sidebar rates
Related Posts
