AUD/USD Facing MAs After Failing at Resistance, As Risk Assets Tumble
AUD/USD made a sharp reversal yesterday as the USD gained momentum and risk sentiment turned negative, which sent risk currencies lower
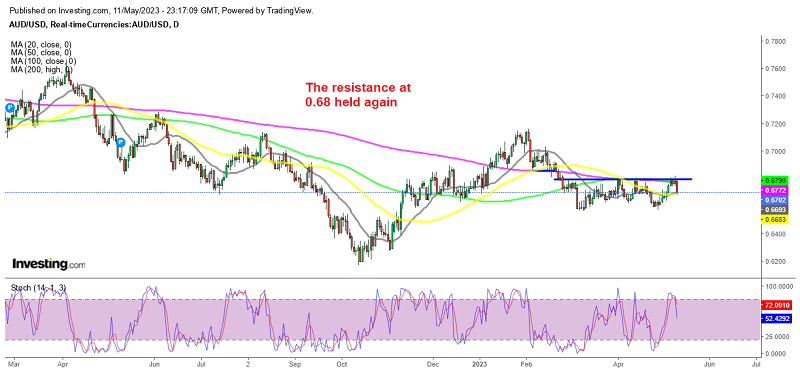
AUD/USD turned bearish in February after being bullish since October, although AUD/USD (Australian dollar – US dollar) has been trading in a range since early March. It has been moving predictably within a channel, respecting the resistance and the support boundaries of this technical pattern.
Earlier this week, AUD/USD attempted to break above the top of the range at around 0.6800, where it has been confined for over 2 months. Buyers pushed the price to 0.8420s, however, this breakout turned out to be short-lived and false, as sellers quickly pushed the price lower from that region. This rejection indicates that sellers are determined to regain control when the market becomes overstretched.
Following the breach of the 200-day Simple Moving Average (purple), the downside pressure on AUD/USD has intensified. There is a possibility that the pair may continue to move lower in the coming days, since the stochastic indicator is reversing lower from overbought levels on the daily chart. However, for greater confidence in the downside scenario, a stronger bearish signal would be required, which would likely be the break of the moving averages where the price stopped yesterday.
This forex pair was one of the weakest in the risk assets group after the GBP, as the sentiment turned negative on softer US economic data. AUD/USD lost around 120 pips while NZD/USD lost 80 pips yesterday.
In Australia, recent data showed that Consumer Inflation Expectations increased as expected, rising from 4.6% to 5%. On the other hand, China’s Consumer Price Index (CPI) for April displayed a slowdown, dropping from 0.7% year-on-year in March to 0.1%, which was below expectations. This represents the slowest pace of inflation since February 2021. Furthermore, the Producer Price Index (PPI) in China decreased to -3.6%, marking the lowest level since May 2020.
These Chinese inflation figures suggest a lack of significant inflationary pressures, which could leave room for potential monetary easing if the performance of the reopening disappoints. But more importantly, it means lower prices for imports of raw materials from Australia. This is bearish for the AUD, so we are following if sellers will push below the moving averages (MAs) which would open the door for further declines.
AUD/USD Live Chart
- Check out our free forex signals
- Follow the top economic events on FX Leaders economic calendar
- Trade better, discover more Forex Trading Strategies
- Open a FREE Trading Account
- Read our latest reviews on: Avatrade, Exness, HFM and XM
Related Articles


Sidebar rates
Related Posts
