DAX: German Stock Market Recovers After 4-Day Selloff
U.S. recession fears sparked a rout in the global stock market, after worse than expected jobs data.


U.S. recession fears sparked a rout in the global stock market, after worse than expected jobs data.
Today’s sentiment has seen buyers come back into the market to take advantage of a 6.5% discount afforded in just 4 days. The DAX has suffered as investors feared a possible recession in the world’s largest economy.
Those fears have receded as global stocks seem to have an attractive discount and the Atlanta Fed raised its forecast for Q3 GDP Growth to 2.9% from 2.5%. Talk is now focusing on economic expansion fueled by further rate cuts from the ECB and the Fed.
Today’s Industrial Production MoM data for Germany showed a sharp increase in activity by 1.4% after last month’s decline of 3.1%. The news left investors with mixed feelings given the not so rosy Balance of Trade data.
Imports increased by 0.3%, which showed the domestic demand was expanding, although less than expected. Most analysts had forecast an expansion in imports by 2.8%, after last month’s drop of 5.5%.
But exports declined more than expected, decreasing by 3.4%, analysts had expected a smaller decrease of 1.5%. The decline has a lot to do with the problems currently ongoing in China, which is Germany’s largest trading partner.
Technical View
The day chart below for the DAX shows a fully fledged bear trend. The market is below the Ichimoku cloud and broke a head-and-shoulder pattern (yellow line) on the way down. The double indication of a bear trend gave way to a rapid drop in prices over 4 sessions.
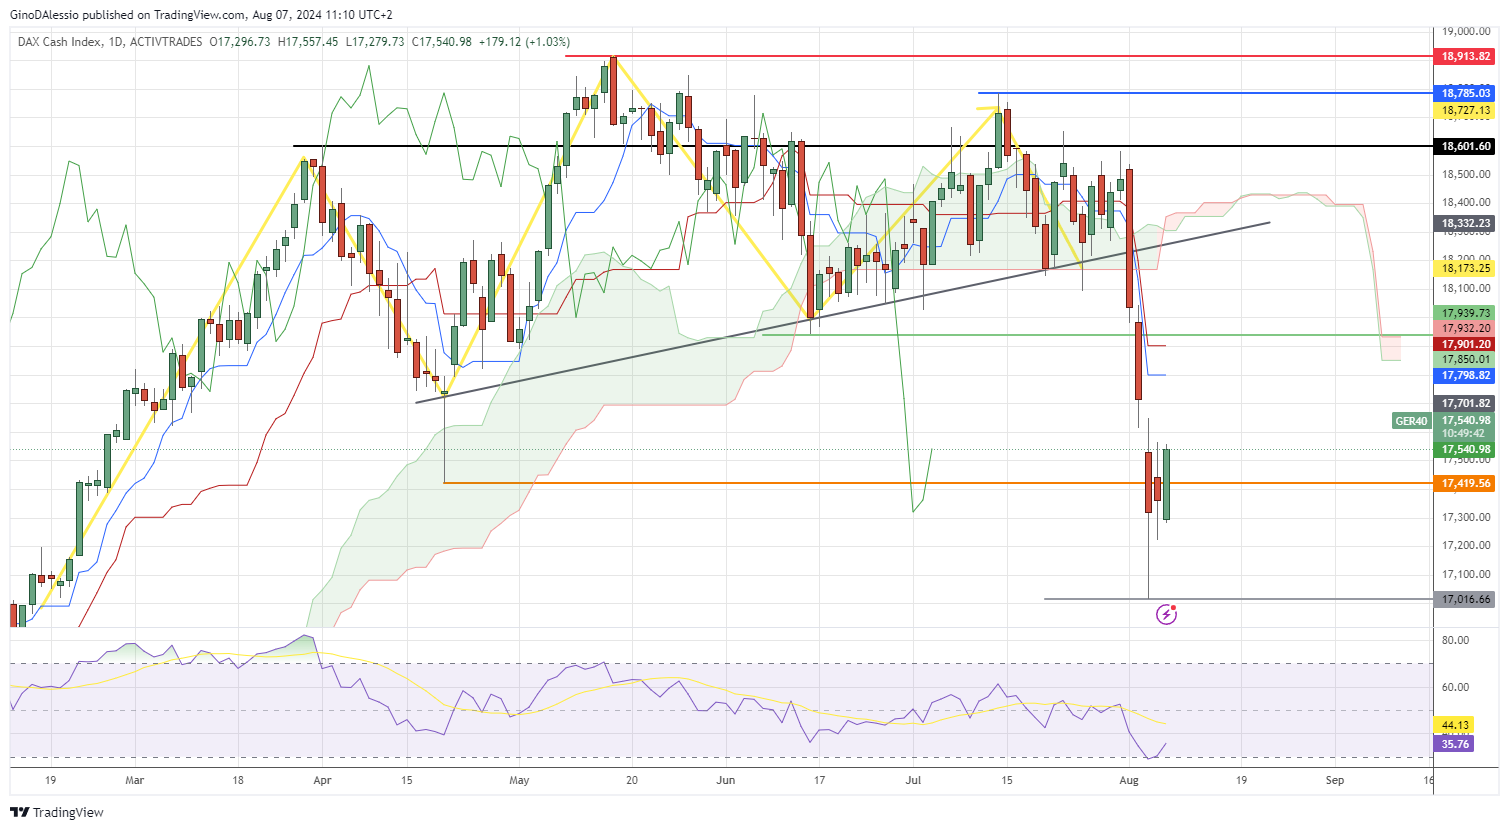
Today’s candle will create an engulfing pattern if it closes around this level or higher. The pattern is a very bullish one, especially when it appear at the bottom of a bearish leg. We have further indication of a possible correction from the RSI.
The RSI dipped below 30 on its recent low 2 sessions ago, and today’s candle looks set to close the index above 30. This level on the RSI would give a signal of a possible correction in the market.
The next resistance would be at the Kijun and Tenkan lines, which coincides with the level of 17,939 (green line). To the downside, the market will find the next main support at 17,016, (grey line), which corresponds to the low of the recent dip.
- Check out our free forex signals
- Follow the top economic events on FX Leaders economic calendar
- Trade better, discover more Forex Trading Strategies
- Open a FREE Trading Account
- Read our latest reviews on: Avatrade, Exness, HFM and XM
Related Articles


Sidebar rates
Related Posts
